Ethiopian Highlands
East African carrier Ethiopian Airlines is hailed as an aviation success story, but have questionable cabin configuration decisions put the breaks on growth?
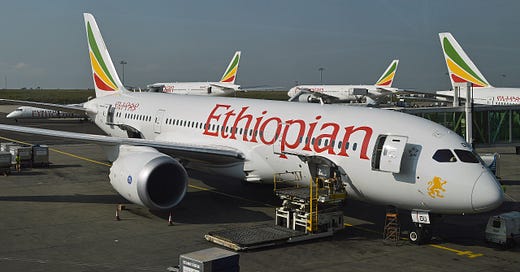
The majestic Ethiopian highlands are characterised by impressive peaks, unique plants like the Abyssinian Rose and nearly 900 species of birds. Also flying in the Ethiopian skies is Ethiopian Airlines, the land-locked country’s flag carrier.
Long considered an aviation success-story, the airline was consistently profitable pre-COVID, growing the bottom line from $75 million (£57 million) in 2010/11 to $183 million in 2019/20. In the same time period the profit margin fluctuated between 2.2% and 11.3% (see chart 1), but few airlines could post persistently positive profits.
Chart 1: revenue & profit margin at Ethiopian Airlines
Unfortunately Ethiopian Airlines’ growth seems to have stalled in recent years. Margins seemed to have peaked in 2015/16 and been on the decline ever since. This is partly due to increasing cost, which increased by 28.2% on an available seat kilometre (ASK, see article) basis in that time. But why has Ethiopian Airlines not been able to increase revenue enough to compensate? Read on the find out more…
In this analysis I am using Ethiopian Airlines’ numbers from the 2022 factsheet. You can see a copy for yourself here.
Chart 2 below shows how as revenue grew from $1.5 billion (£1.1 billion) to $3.7 billion in ten years, average revenue per passenger fell from $404 in 2010/11 to $303 in 2016/17 and then rose again to $388 in 2019/20.
Chart 2: revenue, revenue per passenger & revenue per ASK at Ethiopian airlines
That is not necessarily a bad thing – the airline was profitable and rolling out aircraft. In accordance with the law of demand, more seats can only be filled if prices are lower. Large airline groups like IAG and Lufthansa often report declining average ticket values alongside growing profits.
But I would be more concerned about average revenue per aircraft and per employee (chart 3), which stayed relatively stable over the period too. Ethiopian Airlines introduced their large Boeing 777s with 287 or 365 economy class seats plus 34 business class seats, branded Cloud Nine, in 2010. Their medium-sized 787s (246 economy class & 24 business class seats) followed in 2012.
Chart 3: revenue per aircraft & revenue per employee at Ethiopian Airlines
These shiny new aircraft fitted with in-flight entertainment should have been revenue generating platforms for the airline but this did not happen. Revenue per aircraft actually fell from $40 million (£30 million) in 2011/12 to $30 million in 2019/20, a significant fall of more than 25%. In fairness to the airline this might have been due to more smaller aircraft coming on line than larger ones, which is not shown in the data, although since ASK per aircraft also grew by 29.5% from 2010/11 to 2018/19 suggesting planes were bigger and flying further I have my doubts. But revenue per employee which is much less ambiguous fell by just under 10% from $294 thousand to $267 thousand in the same time.
Ethiopian Airlines’ assets are becoming less productive over time.
A similar story is told in analysing the airline’s profitability (chart 4 & chart 5).
Chart 4: profit, profit per passenger & profit per ASK at Ethiopian Airlines
Chart 5: profit per aircraft & profit per employee at Ethiopian Airlines
Profit per passenger and total airline profit is closely correlated – in 2015/16, the peak year for both, the airline earned $285 million (£216 million) overall and $37.5 per passenger. But performance on these metrics has declined since and profit on a per aircraft and per employee basis displayed similar trends. Profit per unit of output (ASK) though moved contrary to the overall trend, increasing by 16.6% from 2018/19 to 2019/20.
Looking at the five-year-on-year trends (comparing performance in one year with another five years ago, chart 6 & chart 7) clearly shows that things have taken a turn for the worse.
Chart 6: revenue growth per aircraft, passenger, employee & ASK
Chart 7: profit growth per aircraft, passenger, employee & ASK
The charts show clear declines in revenue performance per unit of input and output. At first this did not matter – profitability per unit of input and output was higher in 2015/16 vs 2010/11 and in 2016/17 vs 2011/12. But profitability clearly declined over long-ish periods from 2017/18 onwards. These are nominal numbers – bearing in mind inflation, Ethiopian Airlines’ profitability performance was even worse.
The airline’s management cannot blame this on the 28.2% cost increase. The revenue numbers clearly show that profit is down because of the airline’s commercial performance. However while Ethiopian Airlines’ trends look gloomy at face value, the fact that they are profitable at all in a tough industry shows they are doing a good enough job. The pre-COVID recovery in profit per ASK is particularly promising.
But what was going wrong and how can they make it better, moving up from merely good enough to be excellent again? For me the answer is simple – I think they have far too much economy class capacity and need to install premium economy class.
Look at their 777-300ER’s seat map here – there are five rows of business class between doors one and two, then the rest of the plane, all forty-two rows of it, is coach.
An aircraft’s seat map is a manifestation of a demand curve – the more people an airline carries, the lower the fare of the cheapest seat has to be. With an average revenue of $388 (£294) per passenger in 2019/20, it is quite likely that after ticketing and distribution expenses, GDS fees and so on the airline would have been only receiving $50 to $100 for the last 50 or so seats in economy. On many flights the revenue from that capacity would have been zero since 365 seats is a lot to fill.
Ripping out at least some economy class seats and installing roomier and comfier premium economy class seats should have been a no-brainer for Ethiopian Airlines. There are many benefits to premium economy for passengers (see this article and this article).
Critically, demand for premium economy into and around Africa is potentially high. Economic growth is leading to an emerging middle class with disposable income. These people might not have the cash to fly in business class beds, but a few hundred Dollars more for premium economy is a viable mass-affluent proposition.
Emirates flying in from the east and SAA from the south hve only recently installed the plusher cabin. Kenya Airways and Egyptair do not offer the intermediate cabin. Ethiopian Airlines could have installed the cabin and been hoovering up the revenue, but sadly they did not. The relevant market segments from Europe and the Americas would have flown British Airways, Air France-KLM and Lufthansa instead, not down-traded to economy class on Ethiopian Airlines.
Let’s do a little thought experiment:
Take out 50x economy class seats:
Revenue loss = 50 seats, 80% seat factor, $75 average fare = 50 x 80% x $75 = $3,000
Install 30x premium economy class seats:
Revenue gain = 30 seats, 80% seat factor, $500 average fare = 30 x 80% x $500 = $12,000
Revenue growth per flight = $12,000 - $3,000 =$9,000
Passengers on the plane:
Current configuration = 365 economy class + 34 business class (Could Nine) = 399
399 seats x 80% seat factor = 319 passengers
Configuration with premium economy class = 315 economy class + 30 premium economy + 34 business class = 379
379 seats x 80% seat factor = 303 passengers
Profit growth per passenger = $9,000 / 298 = $29.7 (£22.5)
Profit per passenger was $19.0 in 2019/20 but this will be skewed by many passengers flying shorthaul. Around $30 of profit per longhaul passenger might well be what the airline experienced.
Premium economy class seats are a bit more expensive than economy class products, but not by much. With that and even a bit of the extra revenue eaten up with a few extra Dollars on the meal, a bit of extra baggage and some ground benefits, Ethiopian Airlines lost half of their longhaul profitability potential by not installing premium economy.
oliver AT ransonpricing DOT com, editor
Are you enjoying Airline Revenue Economics? Why not check out some thought-provoking articles from the archive:
Should Oman Air join oneworld?
Surf’s Up! Changes are afoot at Hawaiian Airlines, but will they ride the crest or ding the board?
For even more mind-stretching analysis, buy a Club Class subscription and enjoy:
BA's System Overload – my take on the UK flag carrier’s perennial IT problems
Iceland’s Banks – the Nordic island’s airline may have the world’s best-designed network