

Fortress Airports in the USA
Large hubs are not always American carriers' strongest ports

Airline market lore states that the industry is fiercely competitive. When an opportunity exists, airlines can supposedly send in their planes to capture market share. As a result profits per passenger are constrained and everyone in the airline business makes money apart from the airlines.
Yet the reality is more nuanced. Airlines are subject to competitive forces, but they also enjoy economies of scale and their capacity is limited in both the short and medium terms.
Gathering planes, maintenance resources and people into hubs is much cheaper than spreading capabilities over a network. Schedules are set a year ahead, with only a little scope for change, so sending planes to new places at short notice is tricky.
As a result, airports can resemble natural monopolies where one airline dominates and are known by some in the trade as fortresses. Here, airlines consolidate and offer a comprehensive network product to consumers. Yet fortresses are not just the airline’s hubs.
Some large airports are not particularly concentrated in the hands of just one airline. Others are. I evaluated the 52 largest airports in the United States during a typical travel week in September to find the fortresses.
The dates I chose were 8-Sep-25 to 15-Sep-25, which is near enough to be firm, far enough to be relevant and not a public holiday.
This article was written using data from OAG Schedules Analyser: visit oag.com. Thanks OAG!
Who is the largest airline at an airport?
Figuring out who is the largest airline at any given airport involves a certain amount of ambiguity.
You might take the carrier with the most take-offs and landings. This shows how much runway and gate capacity an airline uses. But should they still count if all their planes are small?
You might also count the number of seats. This is a good indicator of how many passengers need to be processed and the potential for the airport to make like a bandit in the duty free shops. It also shows to a certain extent how committed airlines are in terms of capital employed. But what if all the planes only fly a short distance?
Finally you can total the available seat kilometres (ASK), a measure of capacity that reflects distance flown. This summarises the airline’s financial commitment to the airport in terms of both capital employed and operating cost.
The charts below show that low-cost Southwest Airlines is the largest operator by flights in 20 of the USA’s 52 largest airports, by seats in 23 and by ASK in 22.
They also show that where Southwest is the largest airline, they are the largest to a much greater extent than other airlines are when the others are the largest .Or, put much more simply, Southwest flies to places that other airlines do not.
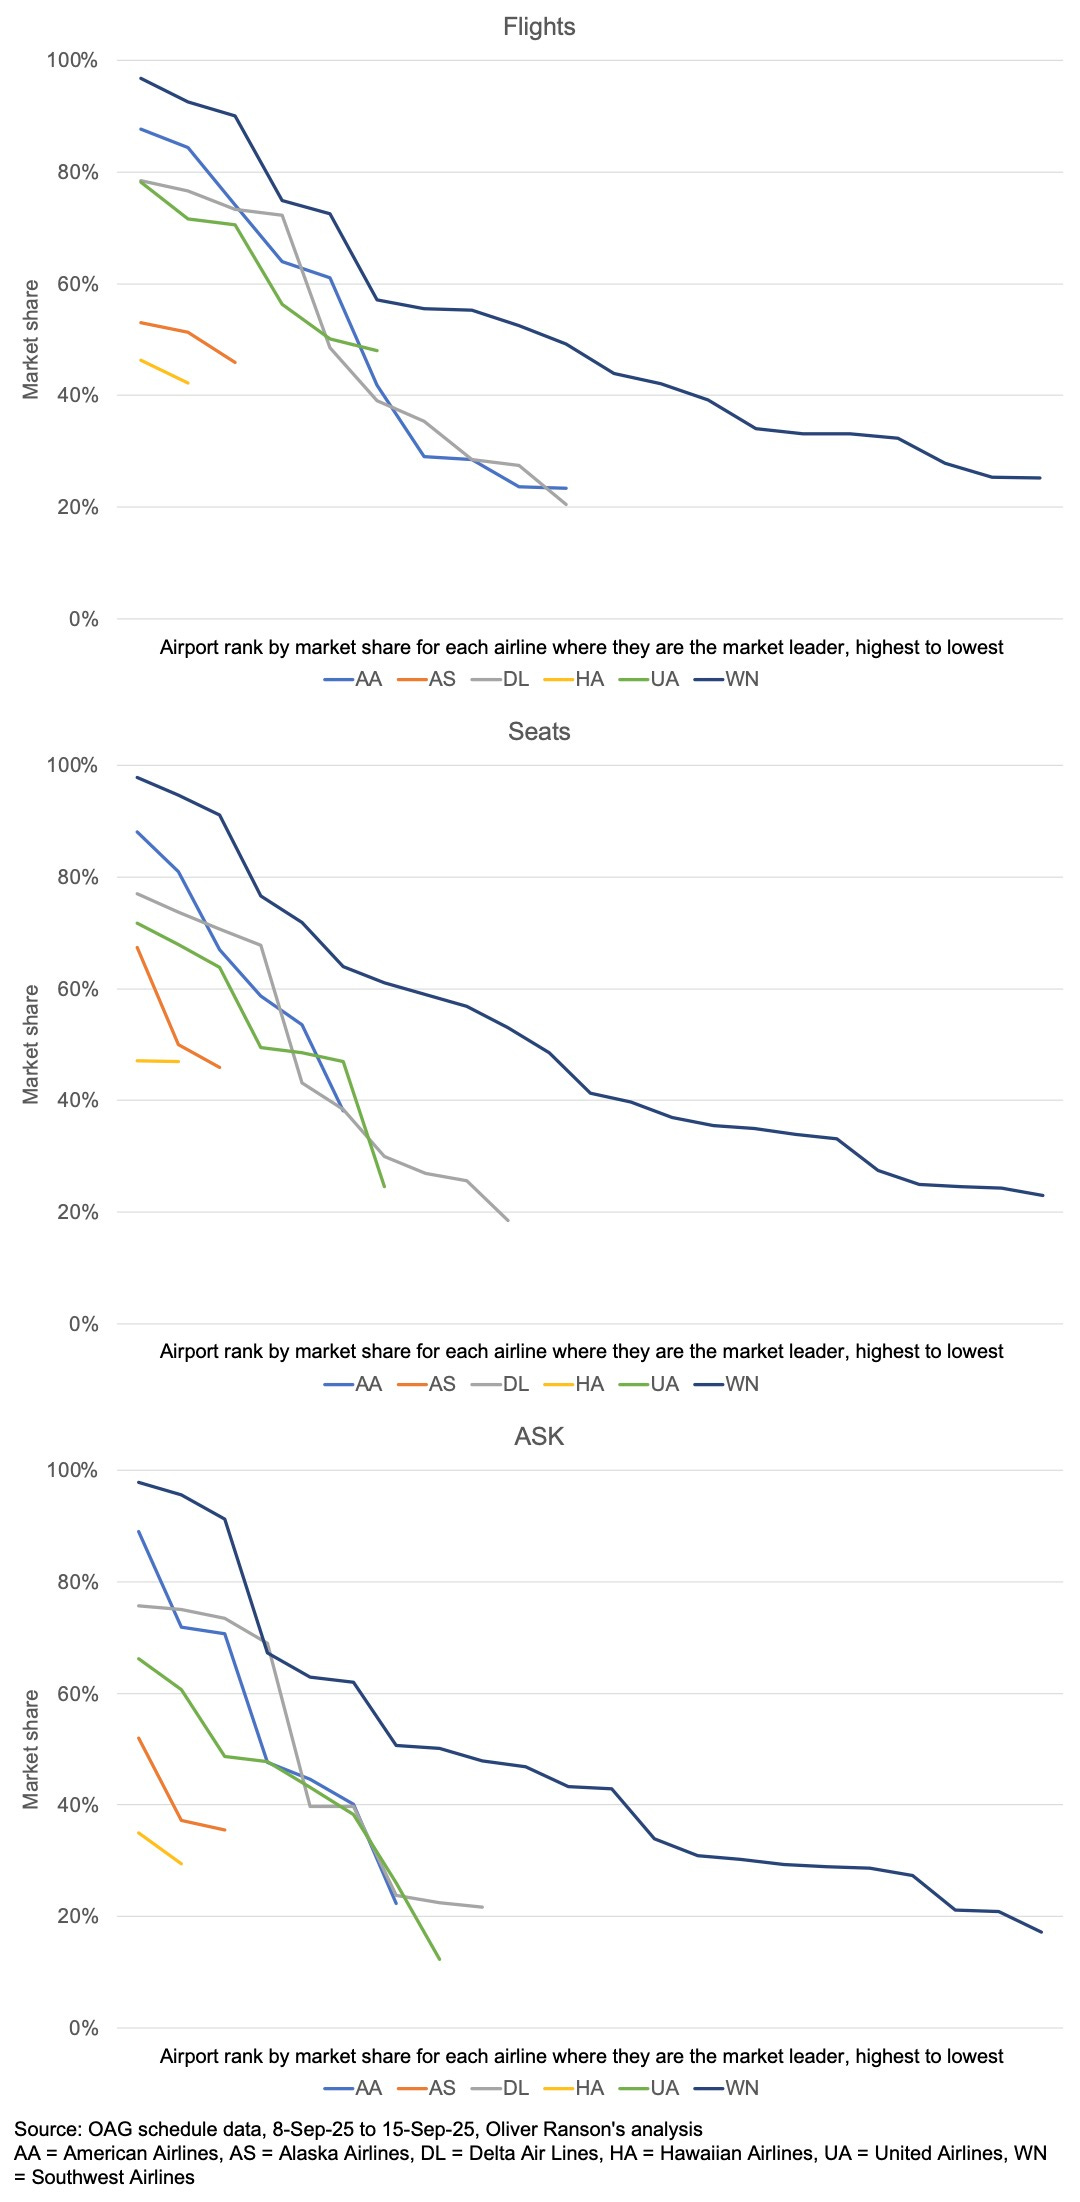
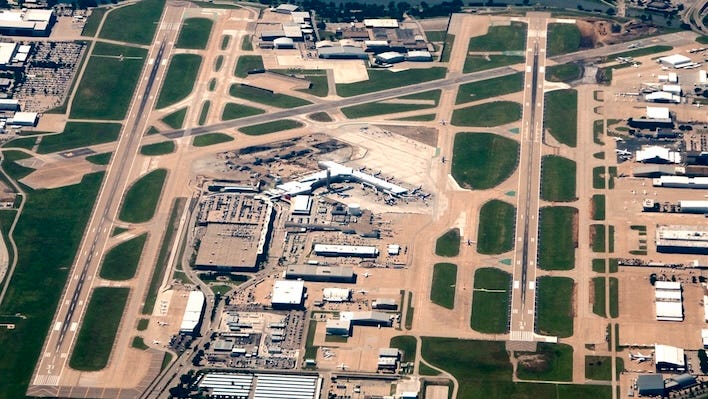
At their Love Field headquarters (hence the heart in their logo and pictured above) Southwest operate an impressive 97.8% of both seats and ASKs. Their dominance at Chicago’s Midway (91.2% of ASKs) and Houston’s William P Hobby Airport (95.6% of ASKs) is also unquestioned.
Love Field, Midway and Hobby are the three greatest fortress hubs of United States aviation. I analysed the top 52 American airports to analyse which are the greatest fortresses.
I selected these 52 airports by collecting all the flights operated by each of the nation’s 13 mainline carriers and totalling up the number of flights, seats and ASKs to find the biggest. I excluded San Juan in Puerto Rico.
The next seven largest airports for US carriers are all overseas – Heathrow, Schiphol, Charles de Gaulle, Fiumicino, Haneda, Frankfurt and Incheon.
At 46 of the 52 airports in the study the largest airline was the same in terms of flights, seats and ASKs.
Using market concentration to measure how much of a fortress each airport is
To evaluate how much of a fortress each airport is I used a measure called the Hirschman-Herfindahl Index (HHI). This is commonly used in competition economics and measures market concentration.
To get the HHI, I first calculated the market share of airlines at each hub for flights, seats and ASKs. I then squared each market share. The HHI is the sum of the squares. To see how it works, imagine two airports that each serve three airlines.
Airport One:
AA has 33% market share
BA has 33% market share
CA has 33% market share
The square of each market share is 33% x 33% = 10.89%.
The HHI is then 10.89% + 10.89% + 10.89% = 32.67%.
Airport Two:
AA has 67% market share
BA has 17% market share
CA has 16% market share
HHI is ( 67% x 67% ) + ( 17% x 17% ) + ( 16% x 16% ) = 44.89% + 2.89% + 2.56% = 50.34%
At Airport One each airline has the same share so the HHI is a relatively low 32.67%. Airport Two is more concentrated because AA has 67% of the market, much larger than BA and CA, so the HHI is a higher 50.34%.
The strongest & weakest fortresses
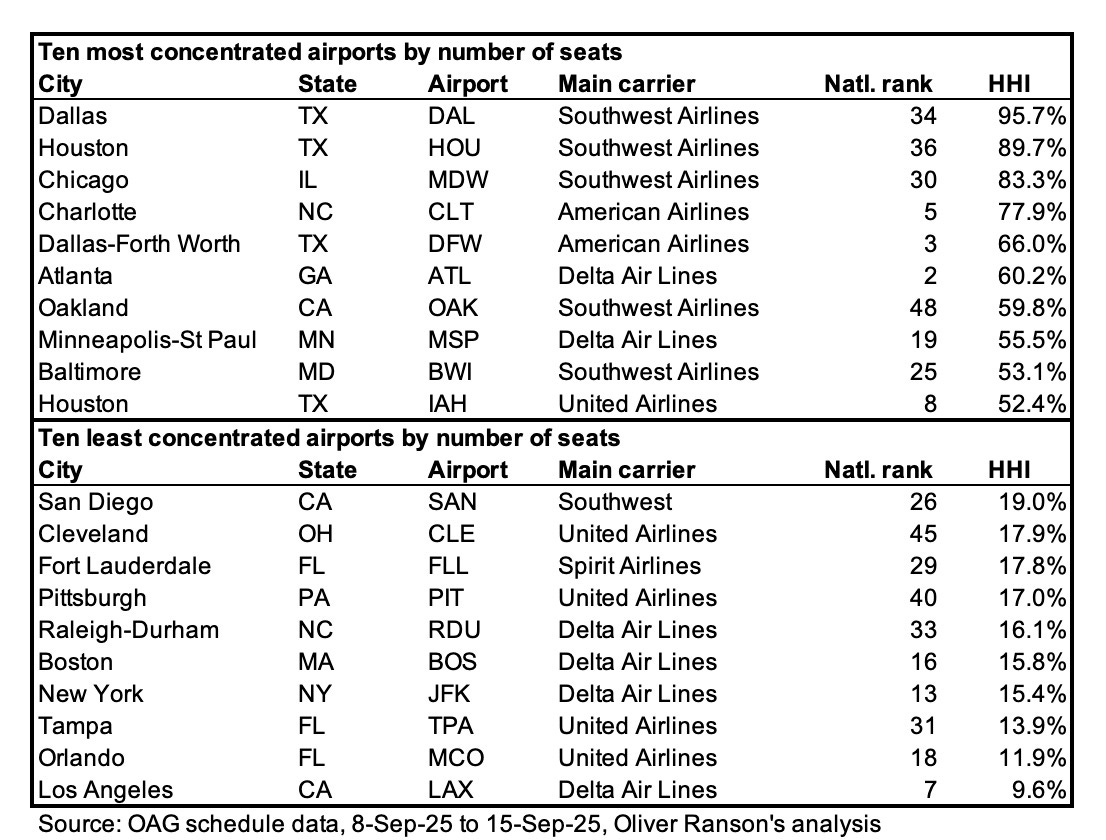
The table below shows the ten strongest and ten weakest fortress airports in the United States, considering the number of seats:
I have similar tables showing the same analysis for the number of flights and ASKs. These are broadly but not quite the same. The tables are available on request.
It is interesting to note that four of the airports in the top ten are in Texas. The Lone Star State’s central location makes it an ideal location for the hub and spoke business model.
While six of the most concentrated airports are in the top half of the national rankings by volume, four are not – including the three most concentrated.
Among the ten least concentrated airports, three are in Florida and two are in California. These are presumably warm, pleasant and sunny destinations that many people want to fly to.
Four of the bottom ten are in the top half of the national rankings. These include the major international gateway airports for New York and Los Angeles, America’s two largest cities.
It makes sense that airports serving large, wealthy cities would be less concentrated because plenty of people want to fly there. Demand overcomes cost.
The relationship between size and concentration is weak
The charts below show that there is little if any correlation between airport size and the extent to which it is a fortress. Bearing in mind the table in the previous section, location and history, which lead to industrial inertia, are likely to matter more.
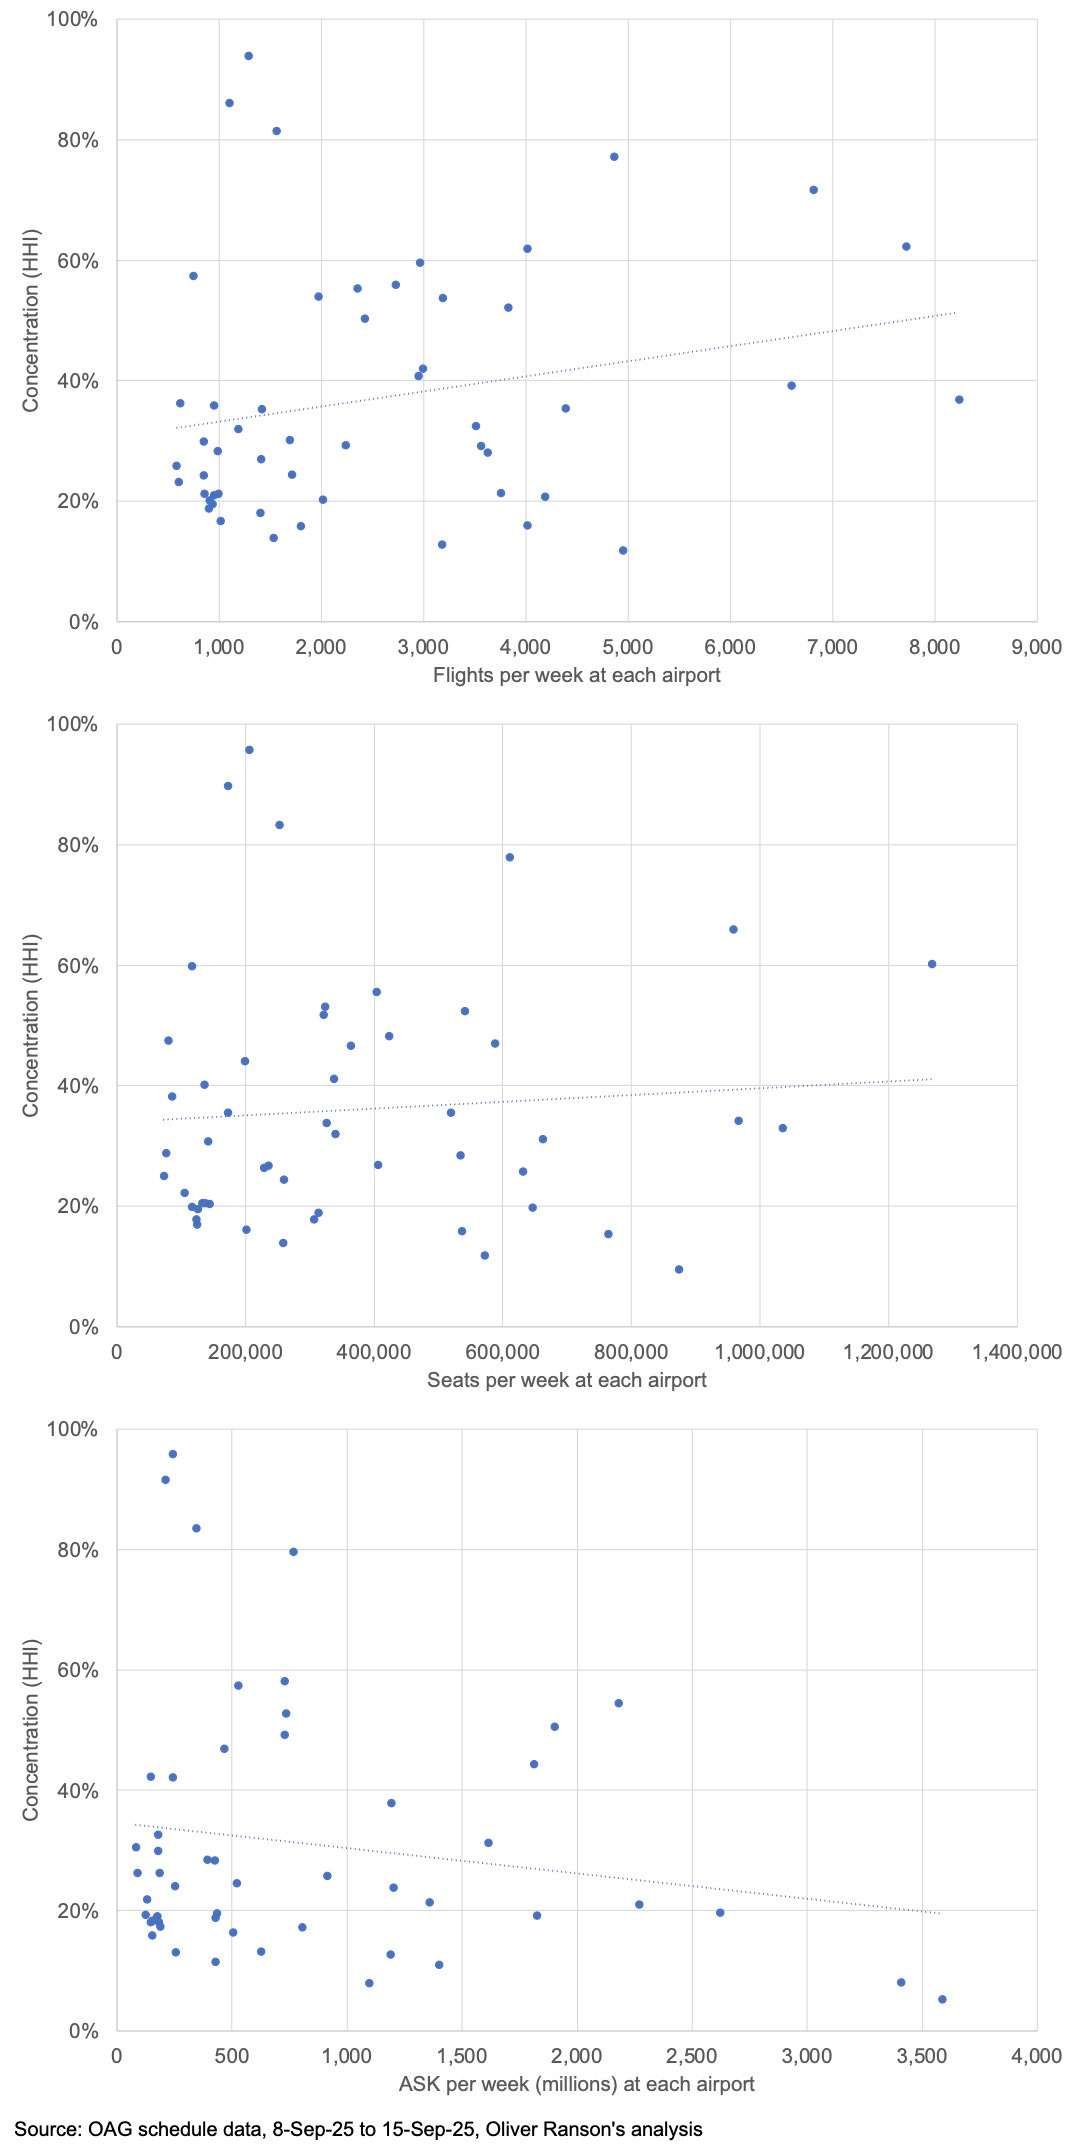
It is interesting to note that the relationship between concentration and ASKs is negative. Meanwhile the relationship between concentration and size as measured by flights and seats is positive. These trends become more pronounced if you remove the three airports (DAL, HOU and MDW) where Southwest has more than 90% market share.
Intuitively it makes sense that larger airports should be stronger fortresses (more concentrated) due to economies of scale. But that only lasts as long as there are a fixed number of airlines to go around, that is it is a domestic market phenomenon. When airports serve cities with strong long-distance inter-continental demand, more airlines enter and the airports become less concentrated.
Conclusion
Southwest Airlines is not only the largest airline at 22 or 23 of America’s largest airports (depending on how you measure it). It is also larger in it’s fortress airports than other airlines are in theirs, with 97.8% market share of both seats and ASKs at Dallas Love Field.
I used the Hirschman-Herfindahl Index (HHI) to calculate the extent to which each of the top 52 airports in the USA is a fortress for just one airline. The HHI is widely used in competition economics. It is calculated by summing the squares of the market share of each airline who fly to and from each airport.
Four of the most concentrated are in Texas. The Lone Star State’s central location makes it an ideal location for the hub and spoke business model.
Among the ten least concentrated airports, three are in Florida and two are in California. These are presumably warm, pleasant and sunny destinations that many people want to fly to.
Four of the bottom ten are in the top half of the national rankings when you consider the total number of seats available. These include the major international gateway airports for New York and Los Angeles, America’s two largest cities.
It makes sense that airports serving large, wealthy cities would be less concentrated because plenty of people want to fly there. Demand overcomes cost.
The relationship between size and the likelihood that an airport is a fortress for just one airline is weak but positive when it comes to measuring the size of an airport by flights or seats. This reflects the economics of the industry as hubs generate economies of scale.
However when the size of an airport is measured in terms of Available Seat Kilometres (ASK), larger airports are less likely to be concentrated. This makes sense too as large international airports attract foreign carriers as well as the US mainliners.
I will be writing more on this topic in the future. We will look at fortress airports in other parts of the world. And we will look at airports that are fortresses not just for airlines but also for alliances. Stay tuned!
[IMAGE CREDIT – cropped]
Read more on Airline Revenue Economics
How much could US air carriers lose thanks to the EVAC Act?
Frontier's First Class Opportunity
Air India's new fleet & network options