

LNER's Inflation-Busting Fare Increases
The East Coast Mainline’s revenue model is too transactional & needs more loyalty


Look at the world from a revenue management perspective and either trains are planes on wheels or planes are flying trains. They both carry a large number of passengers a great distance quickly. They both have the capacity to offer services to people onboard as they sleep, work or relax.
This week I am interrogating a small data set of railway pricing data from the UK’s East Coast Mainline (ECML). We are going to see that fares are progressively getting more expensive in real terms and think about what that means for revenue and loyalty on the route.
My conclusion is worrying for consumers.
There have been five major operators in my memory – Great North Eastern Railway (GNER), National Express East Coast (NXEC), East Coast, Virgin Trains East Coast (VTEC) and London North Eastern Railway (LNER). Recent history of the line is an odd mix of public sector success and private sector failure.
The two public sector operators, East Coast and LNER, took over the line following the other, private sector, operators losing their franchises. GNER’s parent company Sea Containers had financial troubles. NXEC and VTEC went belly up by themselves after overpaying for their licenses.
Service on the route has always been rather good.
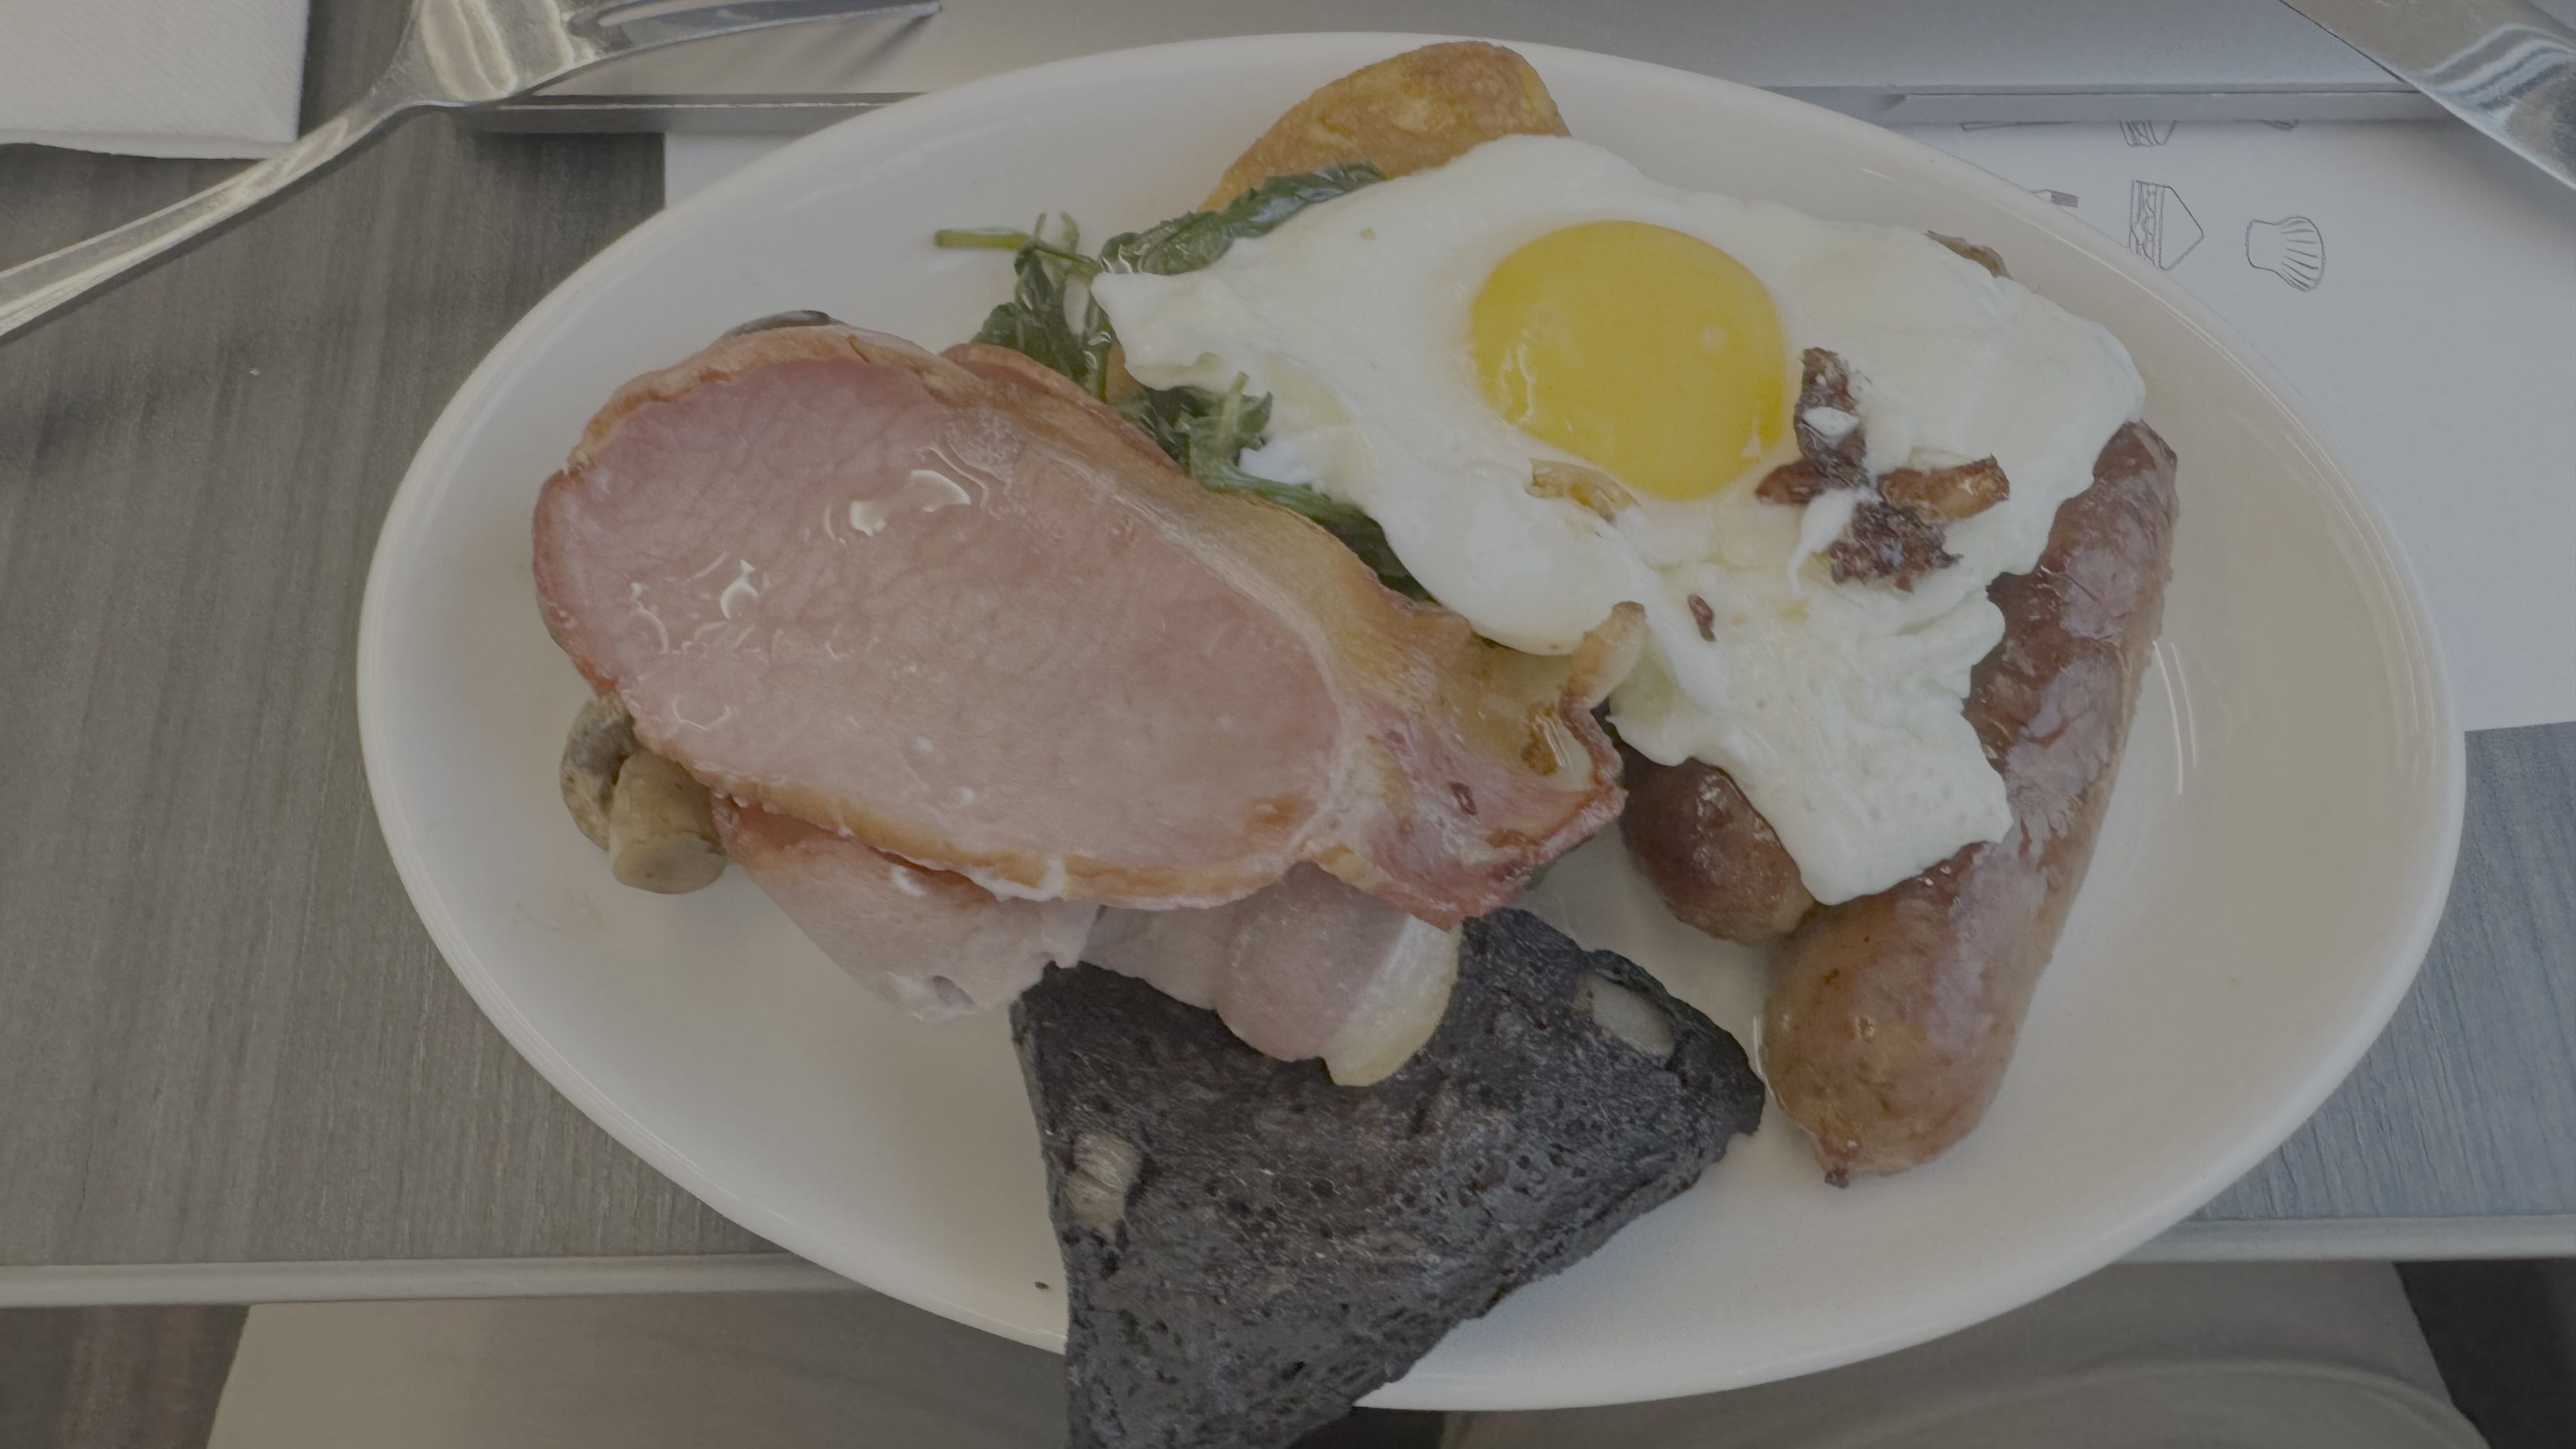
Today’s Hitachi “Azuma” trains whizz back and forth with funky purple first class seats in spacious three-abreast configuration. There is free food and drink. If you are too late for the smashing breakfast (pictured below), there is a rather decent lamb curry (pictured above) on the current menu. Four-abreast standard class seats are in a jazzy bright red.
In my experience the trains are reliable and only rarely delayed.
Underlying demand growth
Unsurprisingly, decent service has led to growing demand.
According to the Office of Rail and Road, a government body, demand increased by 9% in the third quarter of 2024 against the same quarter in 2023 on a journey-by-journey basis. Revenue increased 11% from £2.6 bn to £2.9bn ($3.2bn to $3.5bn) in the same time.
Yet Passenger kilometres increased 10% from 15.1bn to 16.7bn. So revenue per passenger kilometre (RASK increased) from 17.2p to 17.4p (0.8%).
A below-inflation increase in RASK in the face of growing demand suggests that operators are growing their passenger volumes by capturing market share from other modes of transport, or encouraging people to spend money travelling when they might normally have done other things.
In 2024 I rode the train 57 times, racking up 11,543 miles and 23 chains. Every single one of those rides was great, including other on operators Northern, CrossCountry, Trans Pennine Express and East Midlands Trains. I had three cancellations and one or two short but not trivial delays.
Consumer reputation
Yet despite my decent experiences, grumbling about trains is something of a national sport for the British.
Recent articles in the press suggest that railway is falling apart (it isn’t). They say:
1. British trains are 2.2 times the price of rides of a similar length in Europe
2. In 2024 a train was cancelled once every 90 seconds on average
3. Data from Network Rail, the track owner, shows that delays since 2015 add up to a whopping 252 years, six months and 17 days.
I would suggest that growing demand for rail travel shows up newspaper hyperbole.
My pricing data
Being something of a travel nerd enthusiast, I have a decent-ish log of my rail journeys and the prices I paid for travel. This goes back to 2013, covering 315 rides and more than 60,000 miles of rail travel.
Over the years my purchase behaviour has stayed the same. I always buy:
1. About three months ahead
2. A first class ticket
3. An “Advance” ticket, only valid on one specific train
4. Trains operating outside of peak hours.
So I can compare this year’s travel with all my similar trips in the last decade. This is our data set.
Unfortunately I do not have pricing data for all my rides. For ECML trips I have 158 price points and 34 trips without a price, which I have left out of the analysis.
Railway pricing can also get a bit complicated too.
1. In 2017 I bought a Disabled Person’s Railcard offering 34% off travel – I am eligible because I am deaf (see article)
2. All trips in 2023 received 5% cashback from LNER thanks to a Mastercard deal
3. All trips in 2024 and 25 received 10% cashback from LNER thanks to an Amex deal
4. Two return trips (four individual sectors) were free of charge thanks to a generous reward scheme.
Pricing strategy on the ECML is not consistent across the years. In 2014, 21, 22 and 23 London to Newcastle fares were between 9% and 37% higher than fares in the other direction.
In 2013, 24 and 25 they were roughly the same in both directions.
In other years southbound services were between 19% and 22% higher. This is not because I travelled on-peak in one direction and off-peak in another. I always travel off-peak.
The fare difference between north and southbound fares means that plotting the two together on one chart is tricky as the numbers jump around a bit. I think that using two separate charts as I do below is a better way of showing the two data sets.
Analysis
The charts below show what I have actually paid for travel over the last ten years.
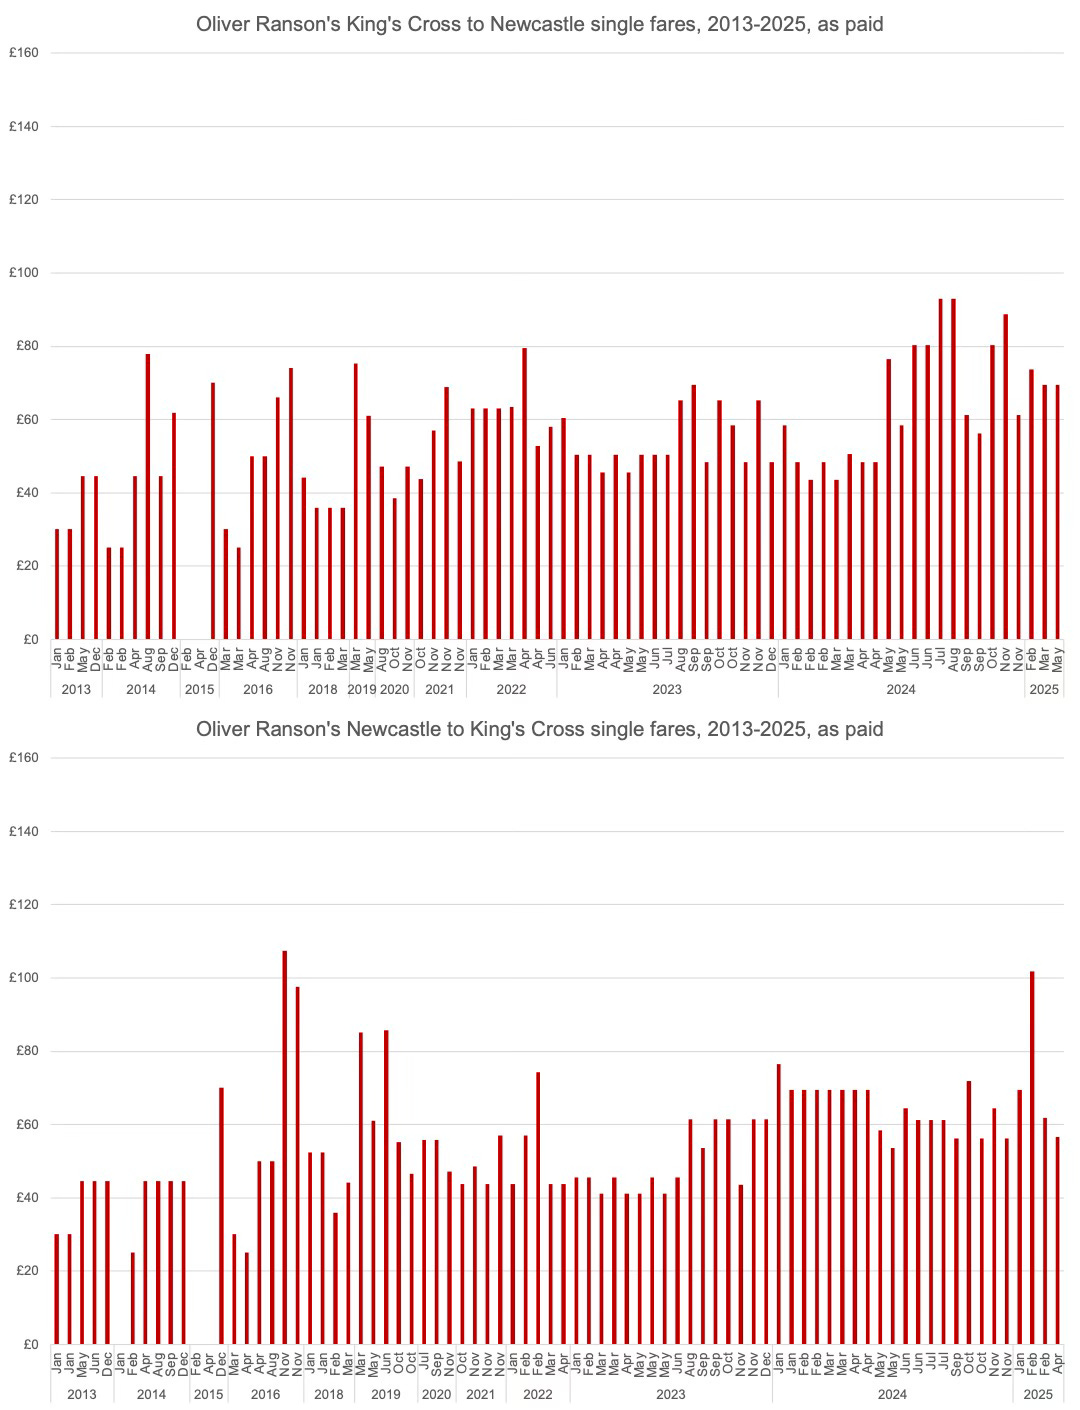
The fares I have paid increased from £39.25 on average in 2013 and 2014 to £64.40 in 2024. This is an above inflation increase of 64% against around 46% inflation over the same period.
But the 2013 and 2014 numbers are skewed. East Coast, the operator at the time, held generous and easy to buy January sales. Ignore these and my average goes up to £48.40, so in real terms I am paying less today than I did eleven years ago.
More recent sales like the Great British Rail Sale come with shorter notice and I tend to have bought my tickets by then.
I consider it better to buy when my travel is fixed rather than wait for a sale that may or may not occur in the face of a fare increase that will definitely occur.
But remember that I now have a railcard offering 34% off, which I did not 11 years ago.
The charts below show what I would have paid had I not held the railcard. The solid lines are the same as in the previous charts, the red outlines show the railcard discount.
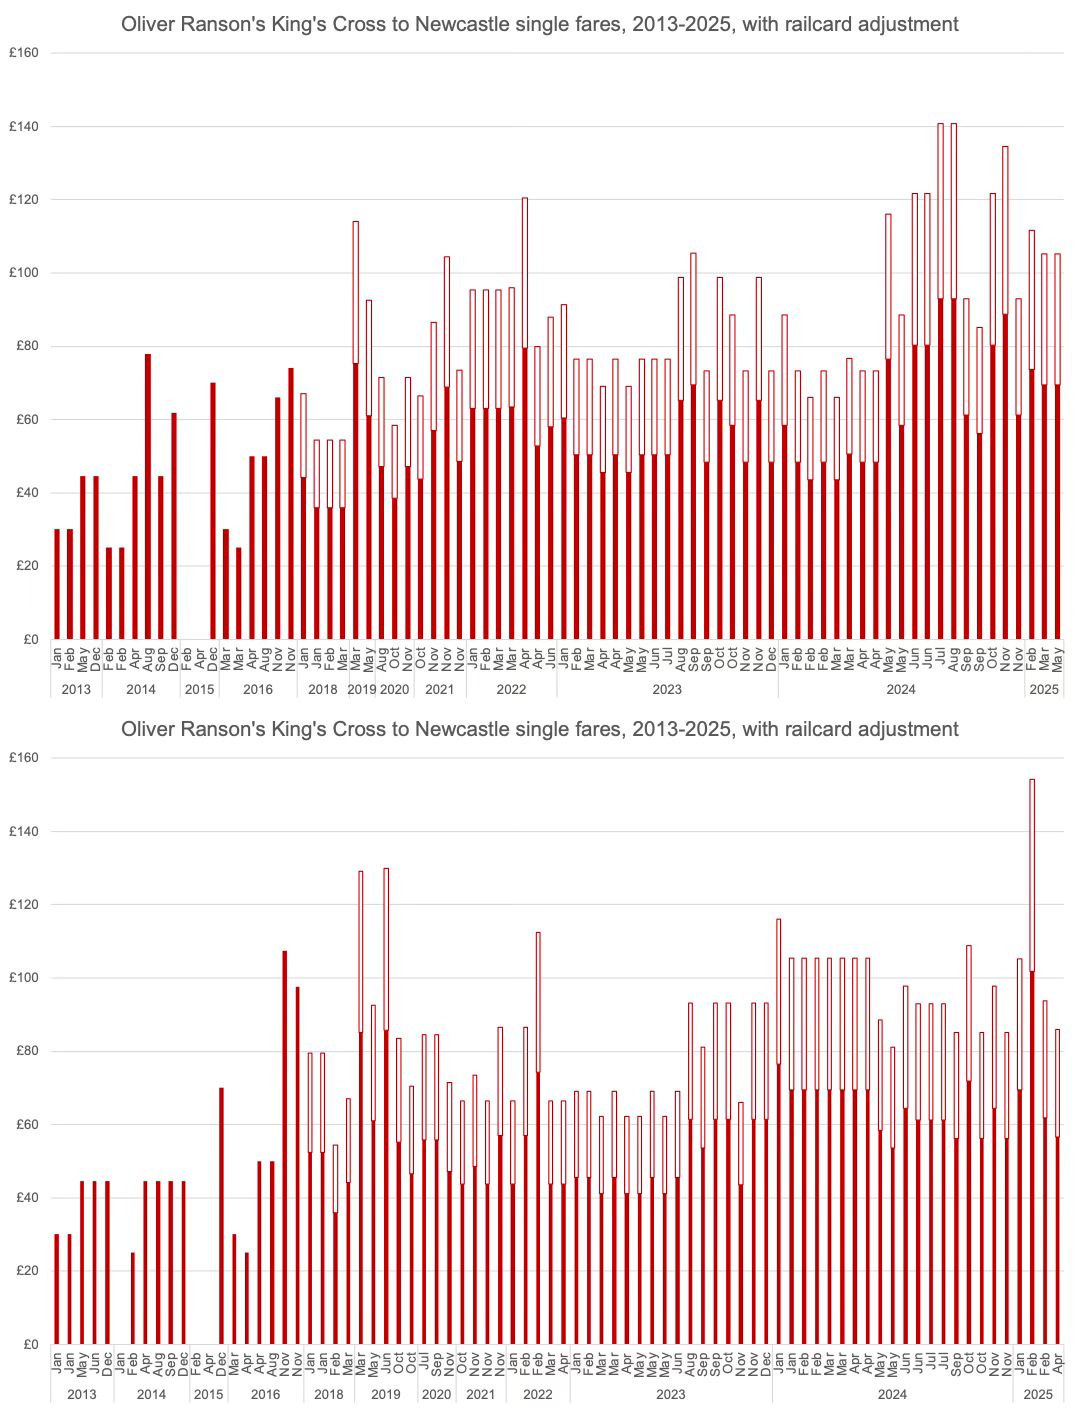
Without the railcard I would have paid £97.57 in 2024 against £39.25 (with the sale fares) or £48.40 (without the sale fares) in 2013 and 2014.
These are increases of 148% and 101% respectively, against 46% inflation. That’s huge!
Fortunately for consumers LNER and other operators are offering cashback schemes through credit cards. These did not exist 11 years ago.
The charts below show the total without railcard fare with the red lines showing the net price and the blue boxes showing the cashback.
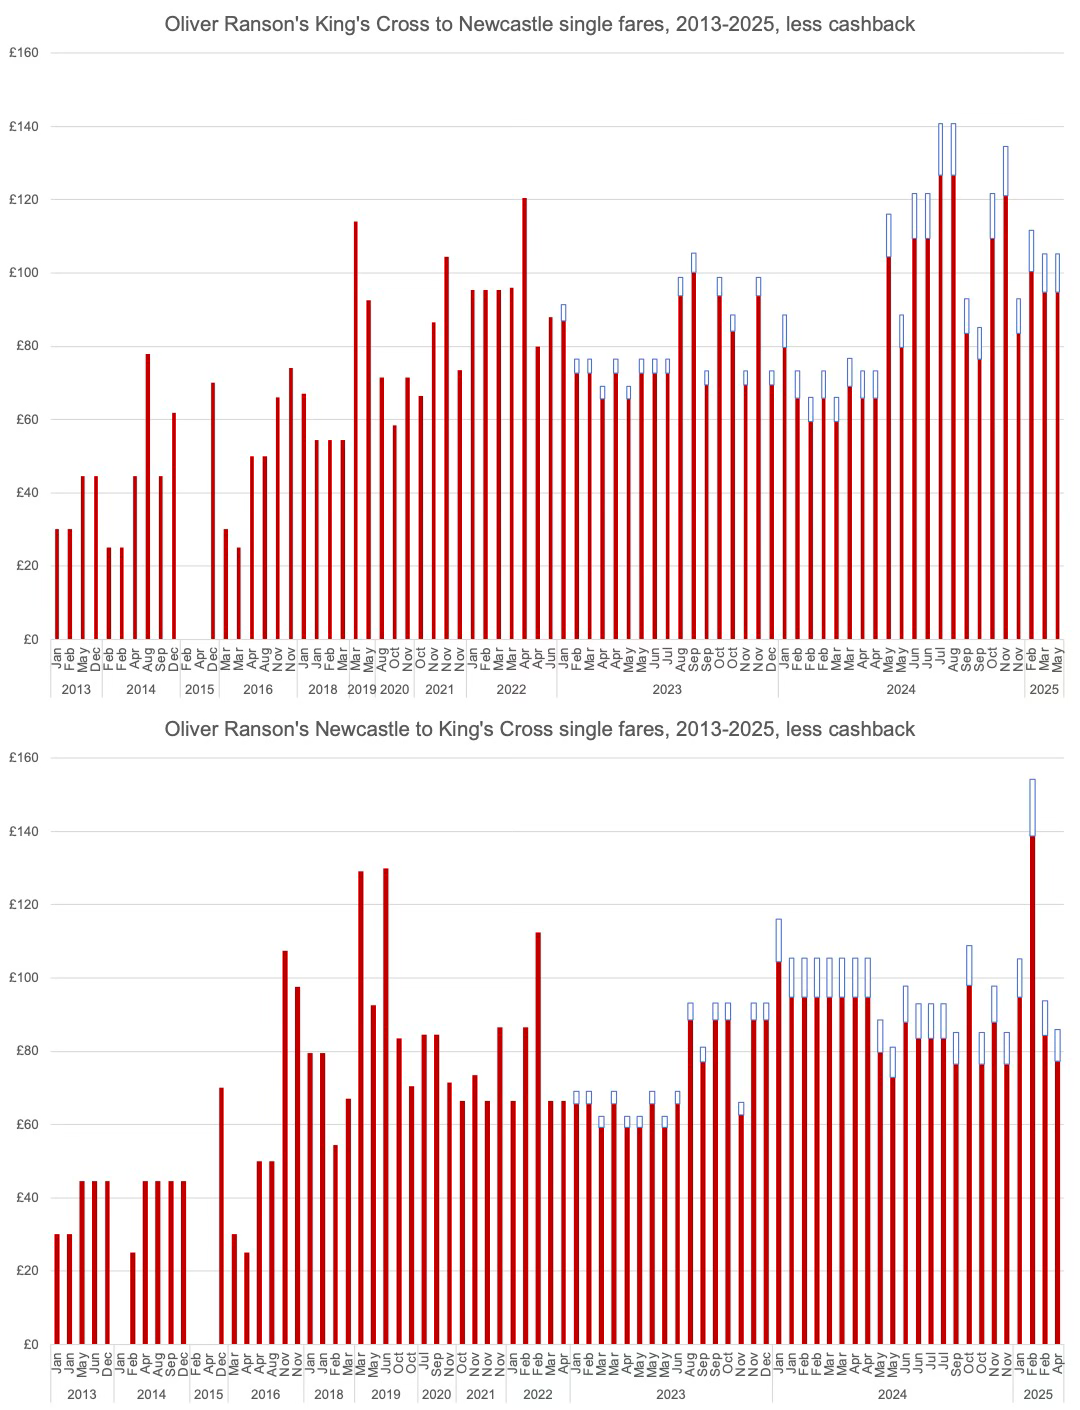
Since 2023 I have collected £577.16 cashback. Not bad.
This takes my average fare for 2024 down to £87.81, an 81% increase (against 46% inflation) over the 2013 and 14 non-sale fares.
Clearly rail travel on my ECML routes is getting more expensive. The Law of Demand is working as advertised.
The fourth set of charts below show my average spend per year first in nominal £ and then in inflation-adjusted 2023 £. These are now for return trips, London to Newcastle and back, because in some years one direction is generally more expensive than another.
The solid red lines represent the fare paid, the while lines with a red border the fare less credit card cashback.
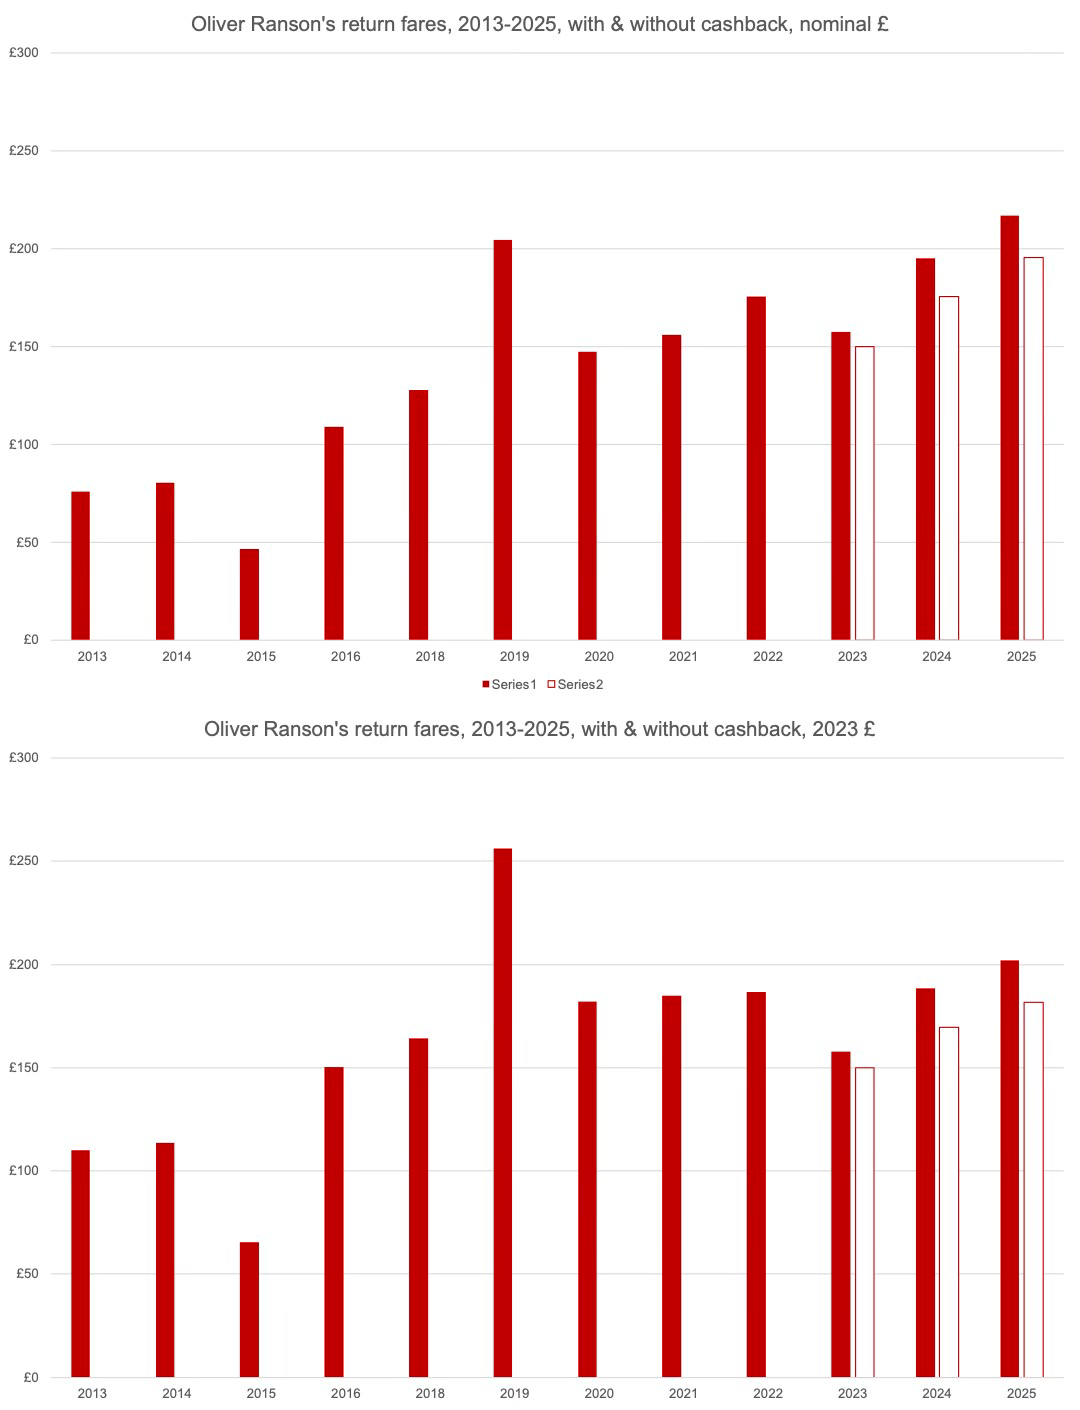
The 2015 average is reduced thanks to the four free trips. No wonder the generous East Coast Rewards scheme is no longer available!
In 2019 I made a few out of character purchases, more last minute than before, pushing up the average.
In 2013 my inflation-adjusted return fares were £109.98. In 2024 they were £169.48 net of cashback. That is a giant 54% real-term increase.
Yet although fares have gone up over the medium to long term, over shorter periods they seem to have come down a bit. The railway now demands slightly less of me than they did in 2020, 21 and 22.
Conclusion
My conclusion is worrying for consumers.
I think that LNER and their government owners have realised that passenger willingness to pay on the railways is higher than they thought. But the political capital available to implement fare increases immediately is limited.
Flexible and fixed-price “Saver” tickets on the ECML have already been replaced with a revenue managed “Semi Flexible” model allowing passengers to take trains within +/- 70 minutes of their booked service.
I think that the railway is going to keep putting up fares. This might be by increasing the gross amounts. It might also be through more aggressive revenue management.
Today’s cashback is the carrot. Once the market is used to higher fares, there will be no more cashback and it will be all stick.
Further remarks
As well as cashback, I also get 2% back from each journey to a loyalty programme called “Perks”.
Unfortunately, LNER’s loyalty product is not good at actually rewarding loyalty. Cashback and 2% “Perks” is available on every ticket. Even for people who only travel once a year.
As a 38 times a year traveller with LNER I would appreciate something a bit more. This could be:
1. A few free return tickets, like Avanti manage on the west coast with “Club Avanti”
2. A higher “Perks” return for frequent travellers
3. Access to LNER first class lounges when travelling in Standard or with other operators.
There must also be potential for an LNER co-brand finance product. Perhaps a debit card like Hilton’s that would give double/treble/quadruple “Perks” on purchases with LNER.
In the face of higher fares, it is only right that loyal travellers should be rewarded. LNER should focus more on loyalty.
oliver AT ransonpricing DOT com
oliver DOT ranson AT inkaviation DOT com