

Which A380 generates the most revenue?
A380 operators are earning a RASK premium over other aircraft in their fleet

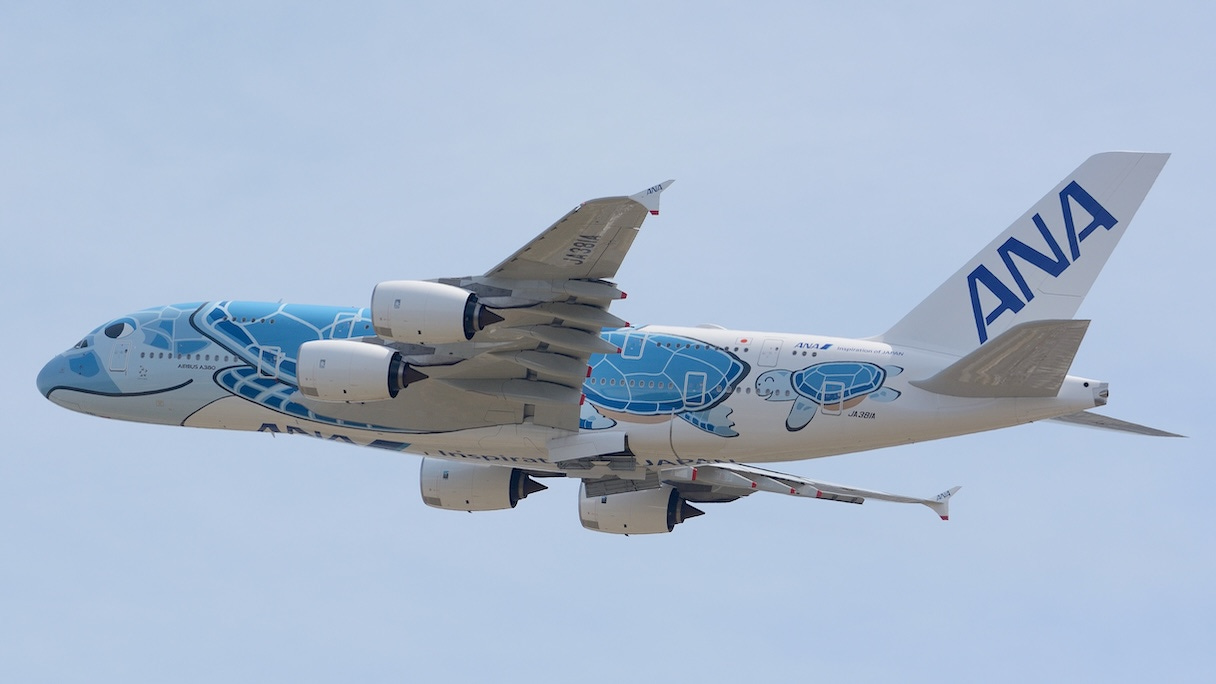
Three All Nippon Airways Airbus 380 super-jumbos each have what is in my opinion the greatest livery in the history of aviation.
The “Flying Honu”, as the airline calls them, feature three Hawaiian sea turtles. The blue one (pictured above) is called Lani, a green one Kai and an orange one Ka-La.
Together, the Flying Honu ply the 3,819 mile route from Narita Airport outside Tokyo to Honolulu in Hawaii. They operate twice-daily across the summer and winter schedule.
In this article I am going to estimate which airline’s A380s generate the most revenue. But first, a few remarks on the global fleet and route network of the super-jumbo…
The Flying Honu are just three of the 189 A380s currently in service. Together they all fly roughly 11.7 million km (7.3 million miles) a week during the summer season and 11.5 million km (7.1 million miles) in the winter*.
That represents 888,248 seats a week in summer and 874,230 in winter.
A380 flights are not only high capacity, they are also long too.
The average summer stage length across 1,728 is 6,797km and in winter it is 6,754km across 1,702 flights.
With 15,033 block hours a week in summer that represents average journey time of 8:42. In winter the global fleet of A380s operate a slightly longer journey time at 8:46, across 14,915 total block hours a week.
* I am using summer schedule data from the week of Mon-8-Sep-2025 to Sun-14-Sep-2025 – winter schedule is for the week of Mon-9-Feb-2026 to Sun-15-Feb-2026 – I am not including the A380 owned by Global Airlines in my analysis.
This article was written using data from OAG Schedules Analyser: visit oag.com. Thanks OAG!
Gentle reminder: most articles are now for paying subscribers. If you have subscribed already, thank you for supporting me. If you are subscribing now, I am offering 25% off here.
Each airline uses it’s A380s to meet demand across a unique pattern of passenger profiles, routes and markets. Emirates is by far the largest operator and, as shown in the table below, uses it’s aircraft across a shorter route profile.
Keep reading with a 7-day free trial
Subscribe to Airline Revenue Economics to keep reading this post and get 7 days of free access to the full post archives.