

Which European hubs are most vulnerable to disruption this summer?
If something goes wrong, how long will the queues get & how quickly can operations collapse?

Airlines and airports are highly optimised environments. So when systems work as intended, things go smoothly.
When systems go down or operations snap, passenger experience degrades quickly. Queues form, flights are delayed and operator reputations suffer.
This article investigates which major European airlines are at greatest risk of disruption at their hubs this summer.
I collected data for the following airlines on Sat-2-Aug-25, which should be peak-of-the-peak with lots of families, groups and irregular travellers off on holiday and checking in together.
Air France-KLM: Air France at Paris Charles de Gaulle & KLM at Amsterdam Schiphol
Skyteam: Air France at Paris Charles de Gaulle, KLM at Amsterdam Schiphol, SAS Scandinavian Airlines at Stockholm Arlanda and Copenhagen
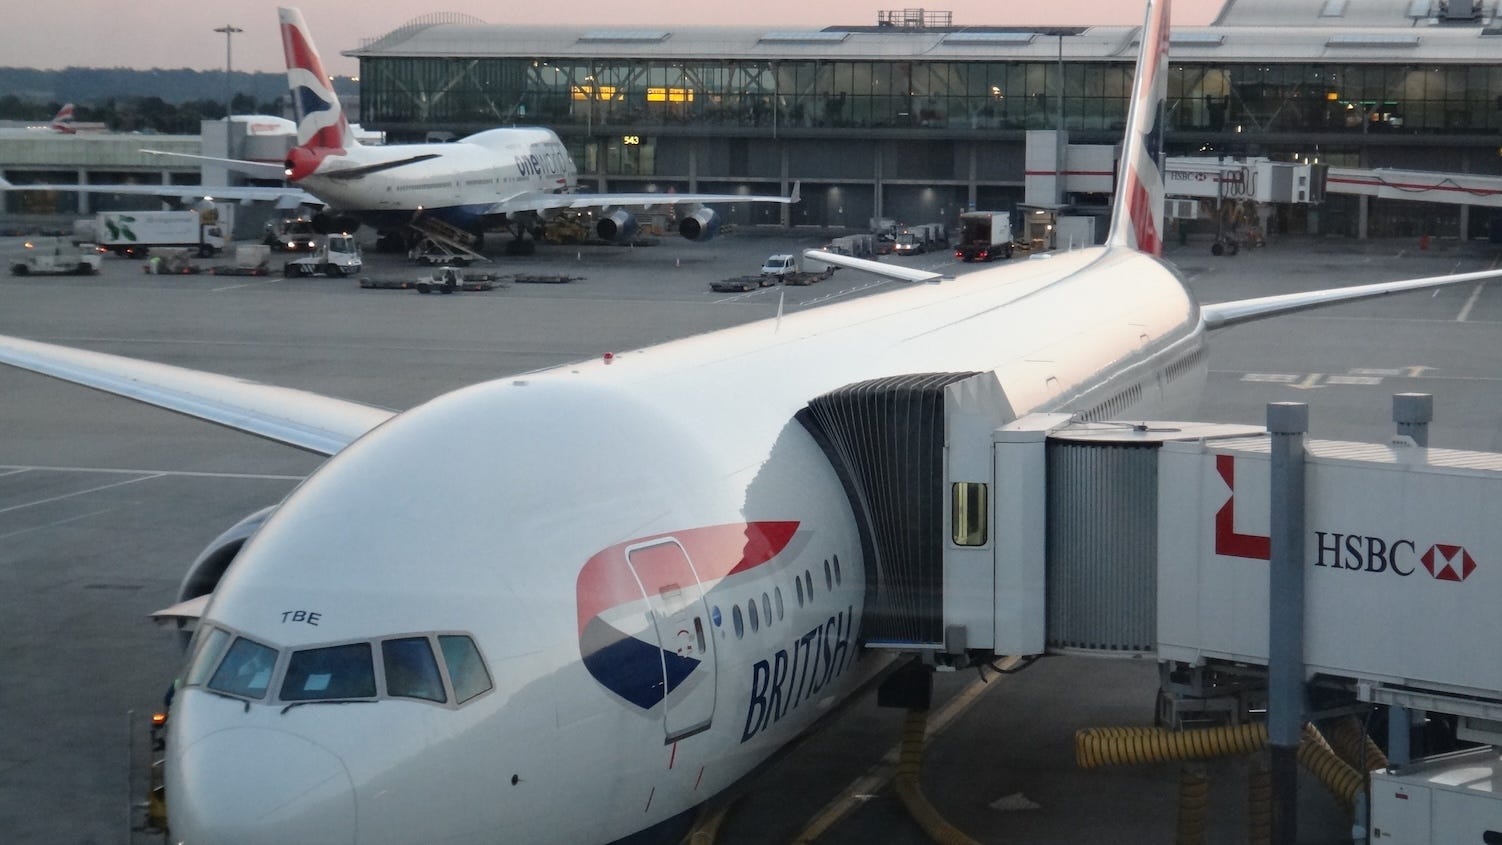
IAG: Aer Lingus at Dublin, British Airways at Heathrow Terminal 5, Iberia at Madrid
Star Alliance: Austrian at Vienna, Lufthansa at Frankfurt & Munich, Swiss at Zurich
LOT Polish Airlines at Warsaw.
This article was written with OAG schedule data: visit oag.com. Thanks OAG!
What can go wrong?
Airlines and airports rely on standardised travel infrastructure to keep operations running. These include four major systems:
1. Departure Control Systems (DCS), which allow airlines and their ground handlers to validate passengers' right to travel and accept them and their bags for travel. DCS handles check-in, boarding and offloading
2. Baggage Reconciliation Systems (BRS), which carry bags through airports. This includes movements from airline counter to aircraft, through security and customs screening and from flight to flight when passengers are connecting
3. Load Control, which ensures that the centre of gravity and weight of aircraft are within limits for safe takeoff and flight
4. Ramp Management, which orchestrates the necessary work for a flight “under the wing” for turning a flight, including fueling, loading and unloading bags.
Anything can go wrong with any of these systems at any time. Power failures, accidental un-pluggings (see article), hacking, operators and many other ghosts in the machine can cause trouble.
Modelling disruption
A complete evaluation of all the risks and impacts of each of these systems would be a major white paper. To keep things simple for this article I have evaluated the impact of a DCS disruption.
DCS disruption results in people queuing. BRS disruption would be a pile-up of bags in much the same way. Wide-ranging Load Control and Ramp Management disruption would lead to disruption air-side and land-side. If there was a disruption at Security it would be similar to DCS disruption, just delayed by a few minutes.
Here are the assumptions:
1. Passengers present themselves for check-in between three and one hours ahead of the flight
2. Passengers arrive at even intervals, so for example if a flight has 120 passengers, one will arrive per minute
3. 67% of passengers are travelling from the hub, so may be disrupted
4. 33% of passengers are connecting, so are not part of the model
5. 85% seat factor
6. 75% of passengers need to check-in baggage or have a visa check, so 25% of passengers do not need to join the queue
7. Check-in takes three minutes per passenger, on average, including the time it takes for people to walk up to the counter, put their bags on the belt, get their passport out and give it to the agent etc…
8. If an airline’s flights are all from the same terminal, passengers check-in together
9. The airport opens when the first passengers arrive*
[* This results in the terminals appear to open earlier than they do in real life, e.g. Heathrow Terminal 5 opens at 4.30am rather than 3am as shown in this article, but I wanted to avoid more complexity in what is already a busy model.]
I also assumed that the airports are “optimised for cost” in the sense that when things are running normally resources are used efficiently. Extra staff, desks or computers cannot be rostered on demand.
These assumptions are not perfect, but they will do for now.
Passenger arrivals
The first thing the model calculates is passengers arriving on a minute-by-minute basis through the day. This is shown in the three charts below. Putting all the airlines together on one chart was a bit messy, so I divided them into three groups: Skyteam, IAG (Aer Lingus is not in oneworld but BA and Iberia are) and Star Alliance.
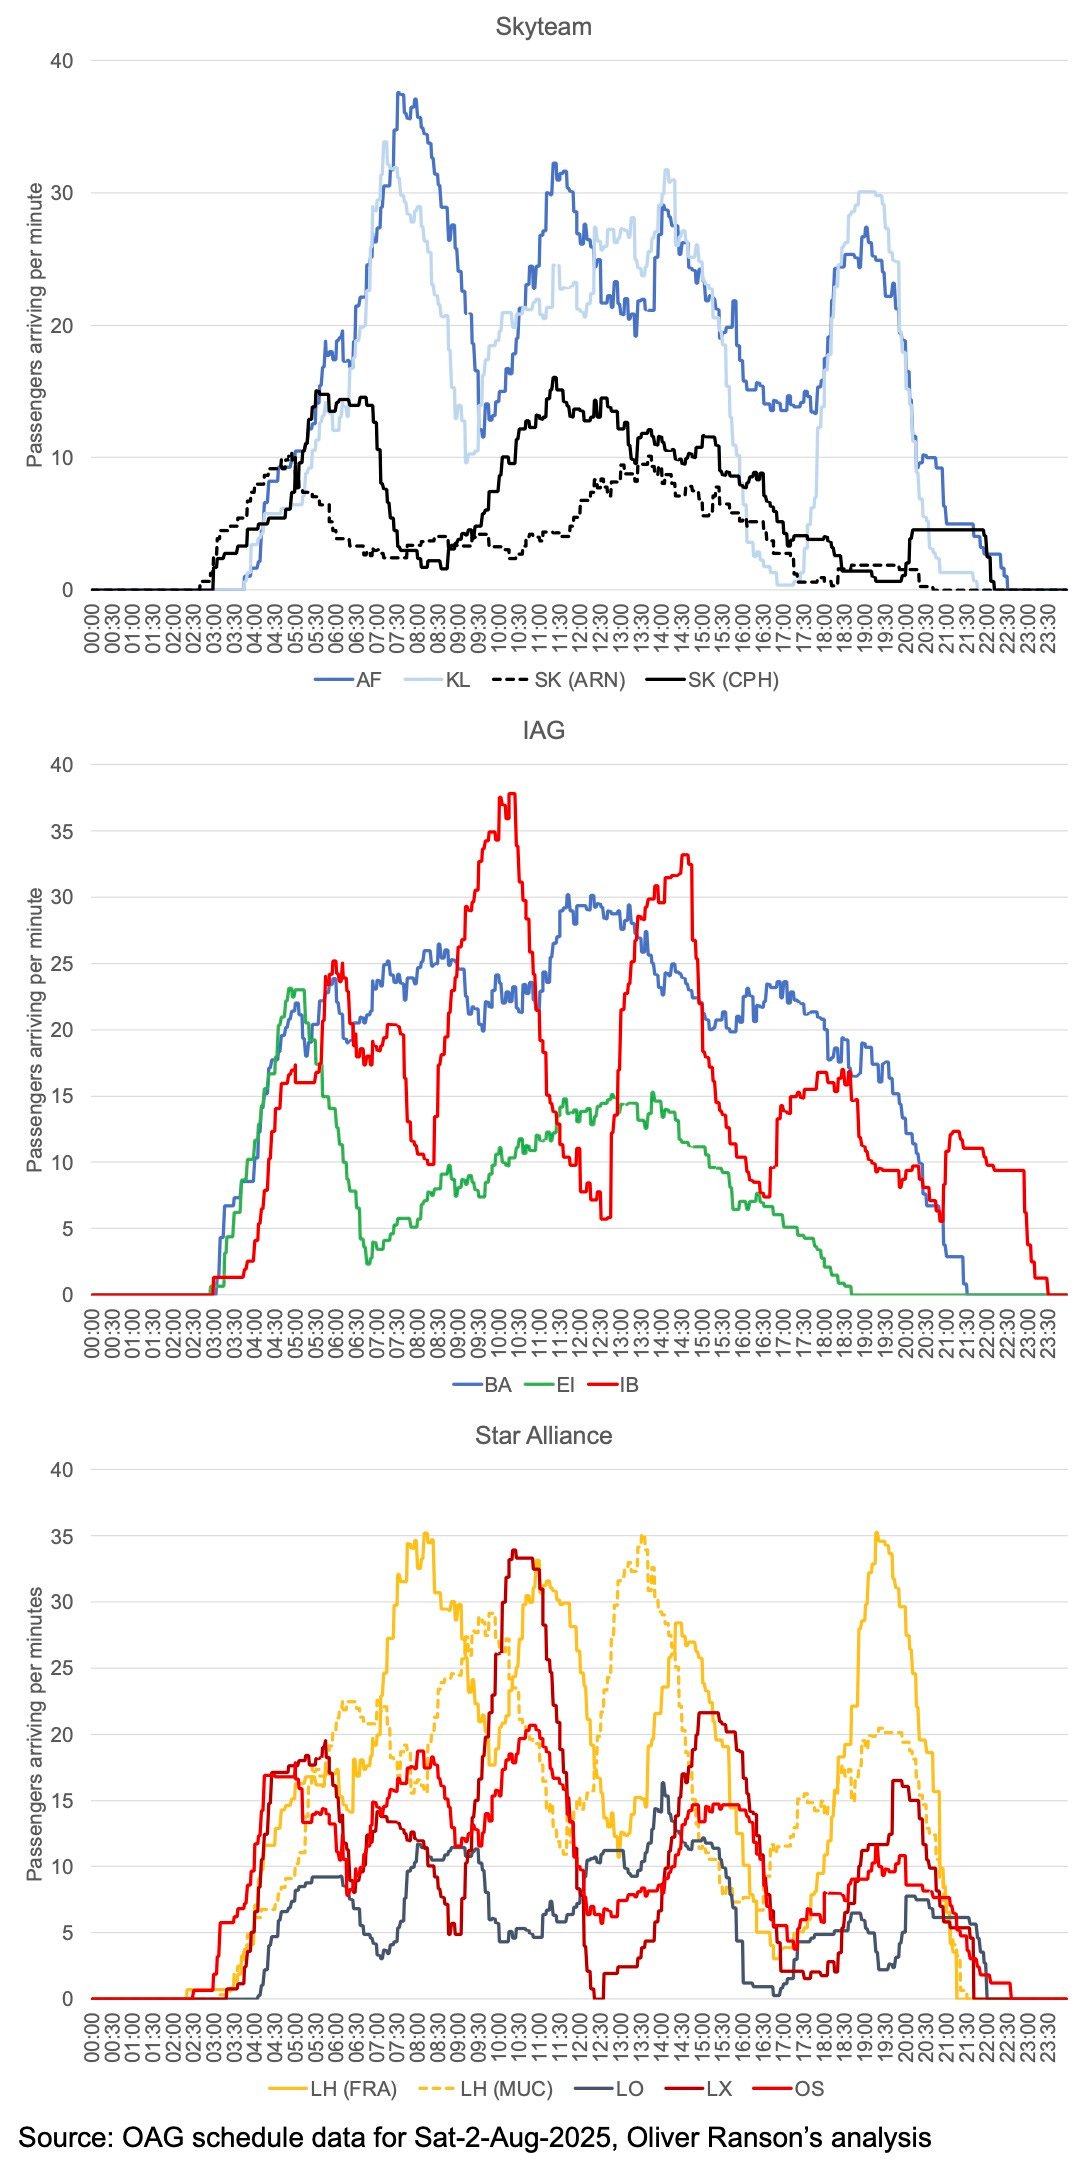
Each airline has quite a different passenger arrivals profile, which reflects their schedules.
Most of the carriers are quite ‘peaky’. Iberia, Swiss and Austrian have five peaks each. Lufthansa has four at both of it’s hubs, as do Air France. SAS and KLM’s passengers are spread across morning, mid-day and evening peaks.
Aer Lingus has a morning peak and then a spread of arrivals through the day.British Airways is more of a ‘hump’. Long-term readers will recognise this from my article about BA’s lounges and loyalty (see article).
Check-in agents on duty & how long passengers have to wait
Airlines do not roster their airport staff on a minute-by-minute basis, but by shifts. I have attempted to estimate how they might roster them myself to ensure that during normal operations passengers do not need to ever wait more than around ten minutes or so.
I have deliberately “under-staffed” the airports a bit, to represent that things will be busier than usual on the first Saturday of August. Queue times tend to rise slightly from time to time, especially when there is a shift change. I did not put lots of thought into this – I rostered by what felt right at the time, just like a busy ops manager would.
It is probably tough for an airline and airport to fully staff to ensure no queues on a bank holiday when they also have to have the same people on the payroll year-round. As this is peak-of-the-peak I think there will be some queues, which is reflected in the model.
The results of the model will of course be biased by my choices, which are based on examining the schedule rather than data about how airlines and airports actually roster their staff.
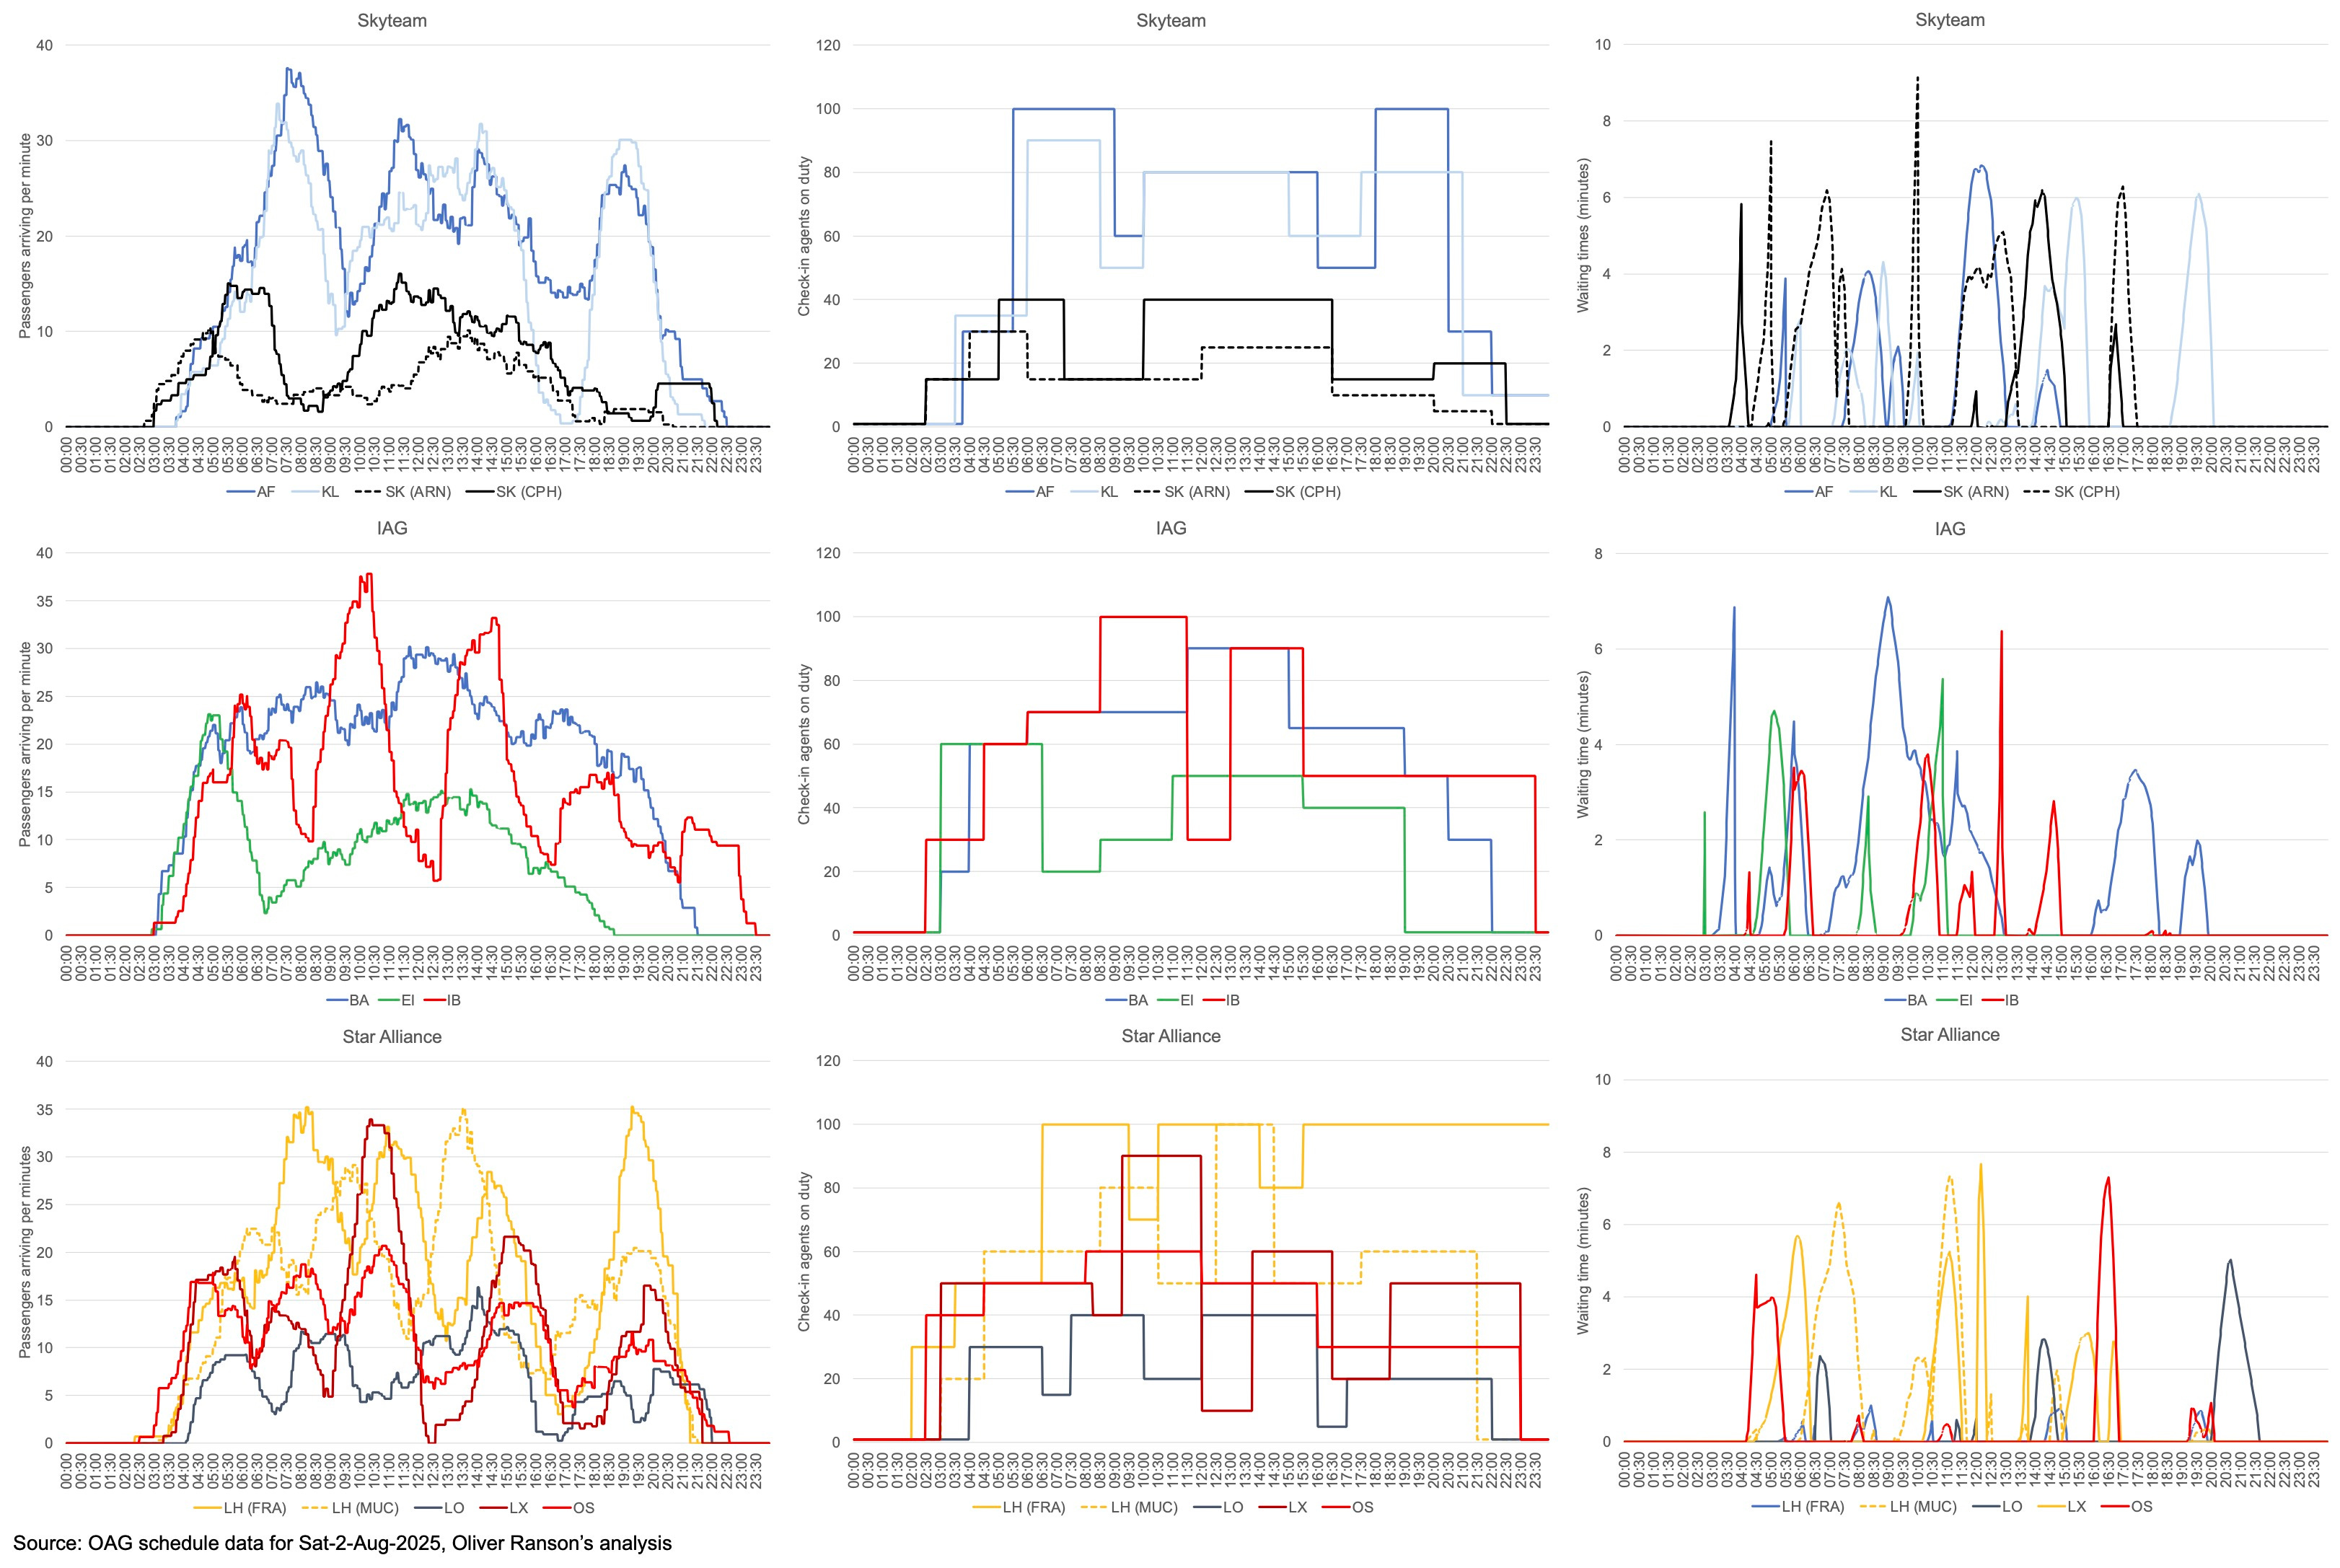
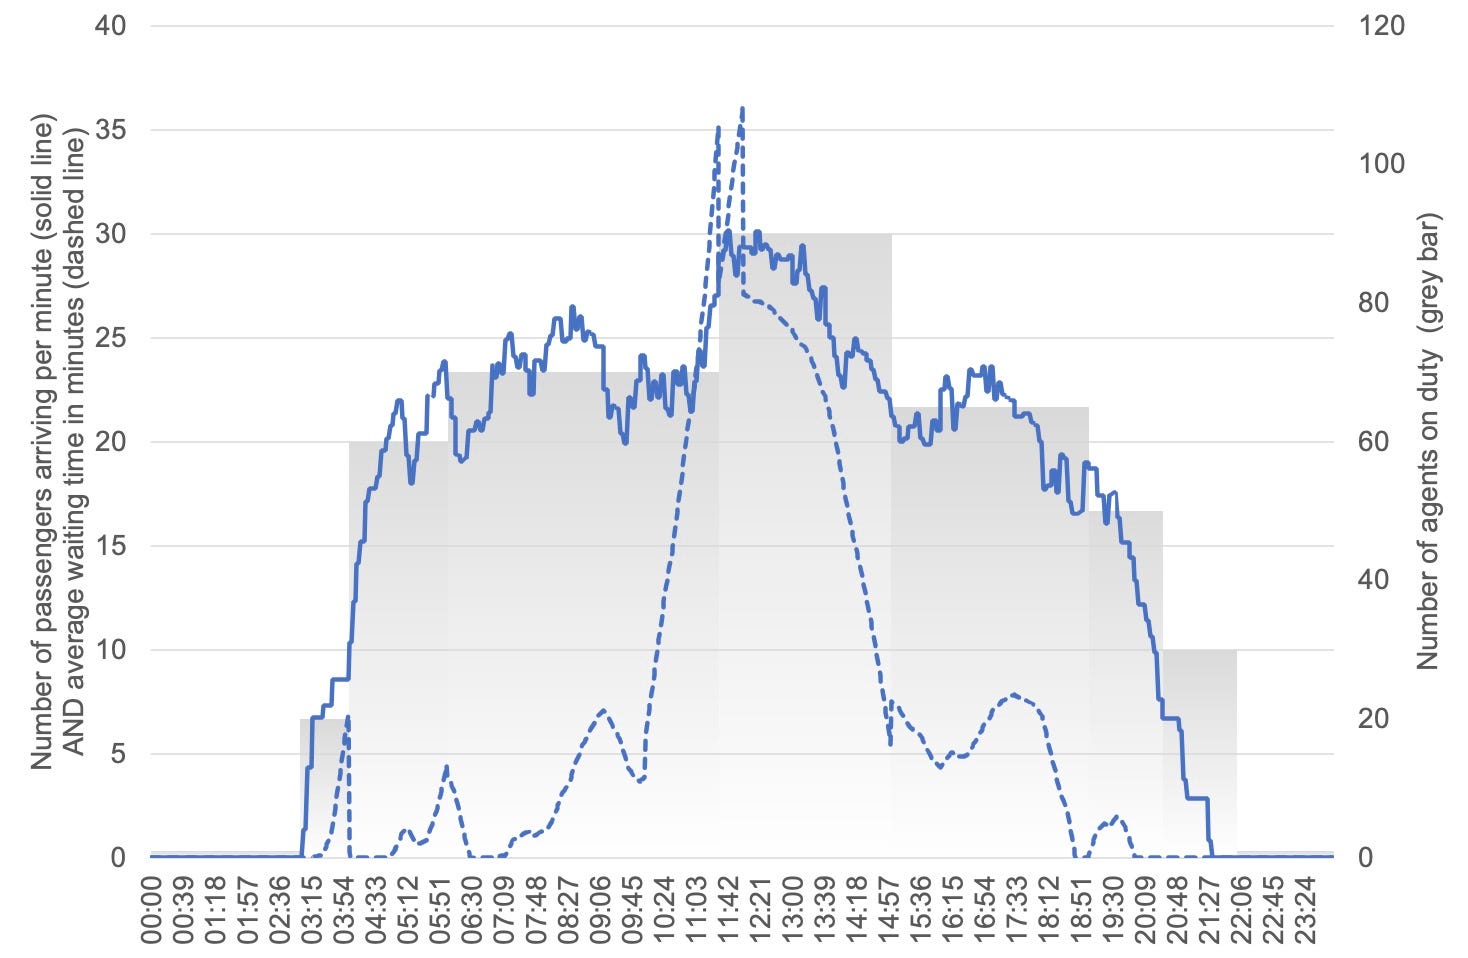
The charts below show these stats. The one on the left is the same as the one above, presented for easy comparison. The one in the middle shows my estimate of the number of staff on duty at any given time.
The chart on the right shows modelled waiting times under normal operations. That means arrivals as I modelled them and three minutes to check each passenger in..
Notice how short the queuing time is. Have you ever wondered why airports have so much queuing space but hardly ever anyone waiting? This is why. When things go wrong, those tensa-mazes fill up quickly.
It is possible to combine the charts into one graphic on an airline-by-airline basis. Here is the chart for BA.
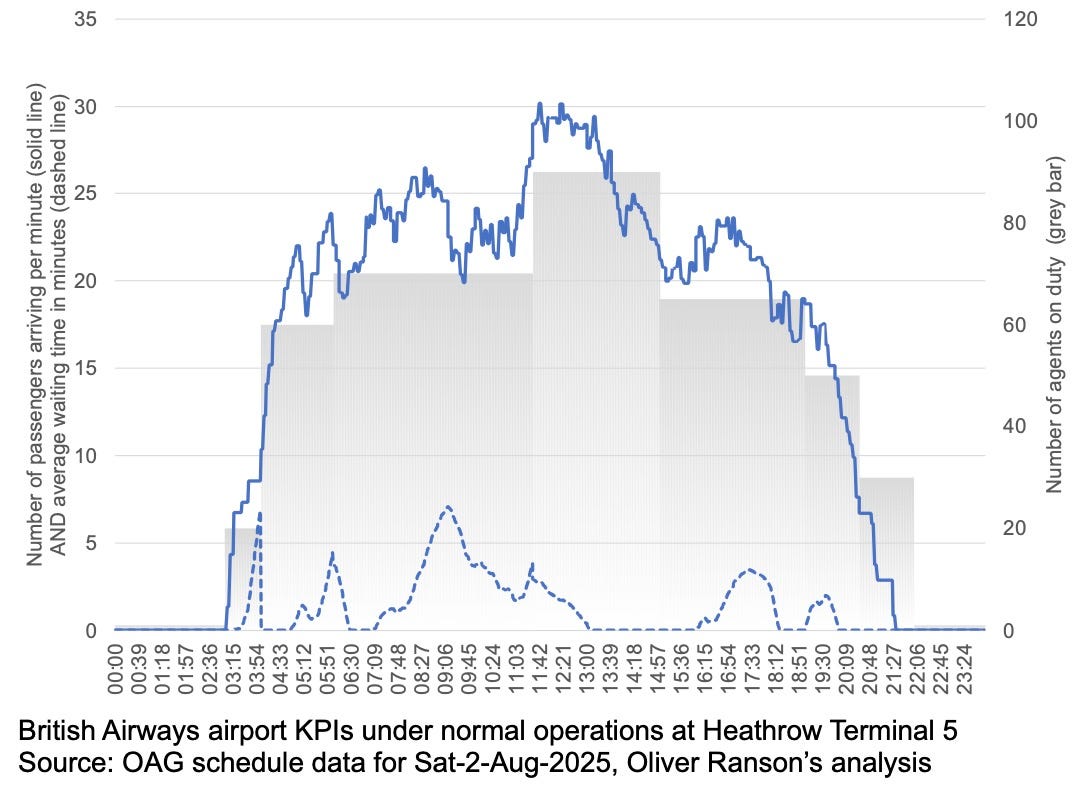
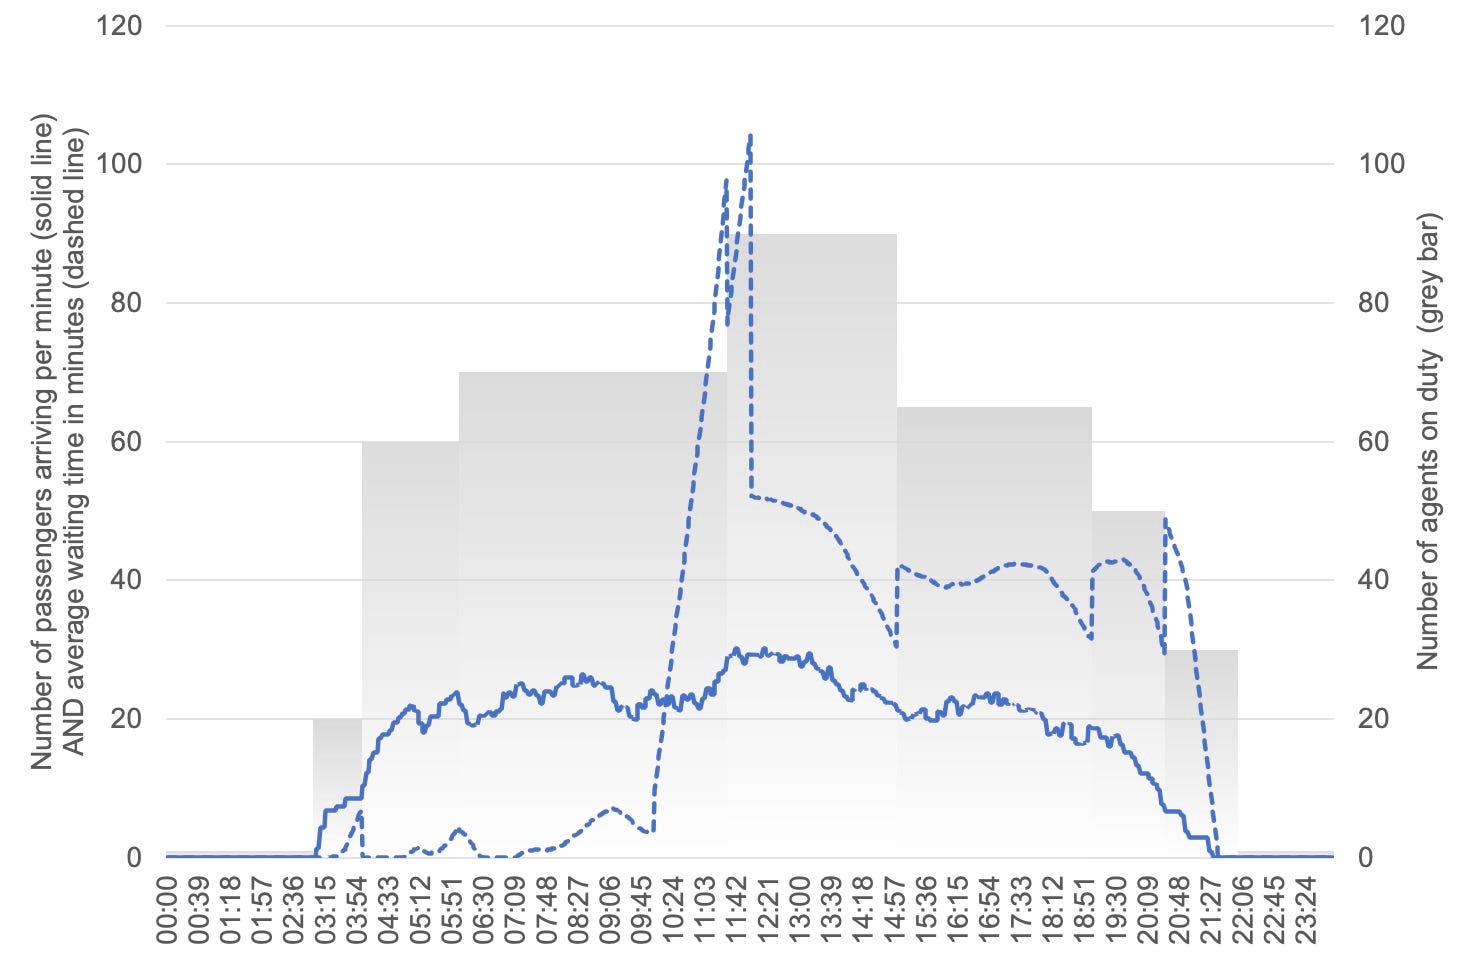
Now let’s apply a disruption. Suppose that due to some ghost in the machine, starting from 10am it now takes six minutes for a passenger to check-in rather than just the normal three. Assume the disruption ends at 12 noon. See what happens in the chart below…
Look at how the queuing time shoots up! Passengers are queuing more than 30 minutes, even with the extra staff coming on duty at 11 o’clock.
Even with just a “small” one minute increase in the time it takes to check in each passenger, airports start to struggle. This is when those normally empty tensa-mazes fill up…
It takes a long time for the queues to dissipate. The terminal does not fully recover until around half past six in the evening. The problem is that the disruption to passengers does not end with the end of disruption to the system. Queues still need to be processed.
Notice the two sharp falls in queuing time which happen first when the staff on duty goes up and when the disruption ends at 2 noon.
When this happens I would expect BA to start cancelling domestic flights and pushing back the schedule as far as possible. Most passengers should still make conformance. Just…
Now let’s apply a medium-sized disruption and double the check-in time from three to six minutes, shown in the chart below (note the changing scale on the left-hand axis).
Queuing time goes up to more than an hour and a half. And the disruption lasts all day.
In this model British Airways would not be able to do anything about the passengers arriving between 10am and 12 noon, but they would start to cancel flights (domestic first, then shorthaul and longhaul only if absolutely necessary) and send out “do not come to the airport” e-mails and texts.
This is when people start queuing in the car park…
Finally let’s give BA a really serious disruption to deal with. Nine minutes to process each passenger rather than the usual three (in the model). In the chart below queues would be more than an hour all day and even then BA would not be able to process all the passengers.The dotted line showing queuing time at the end shoots to “infinity”.
(Once again, please note the changing scale on the left-hand axis)
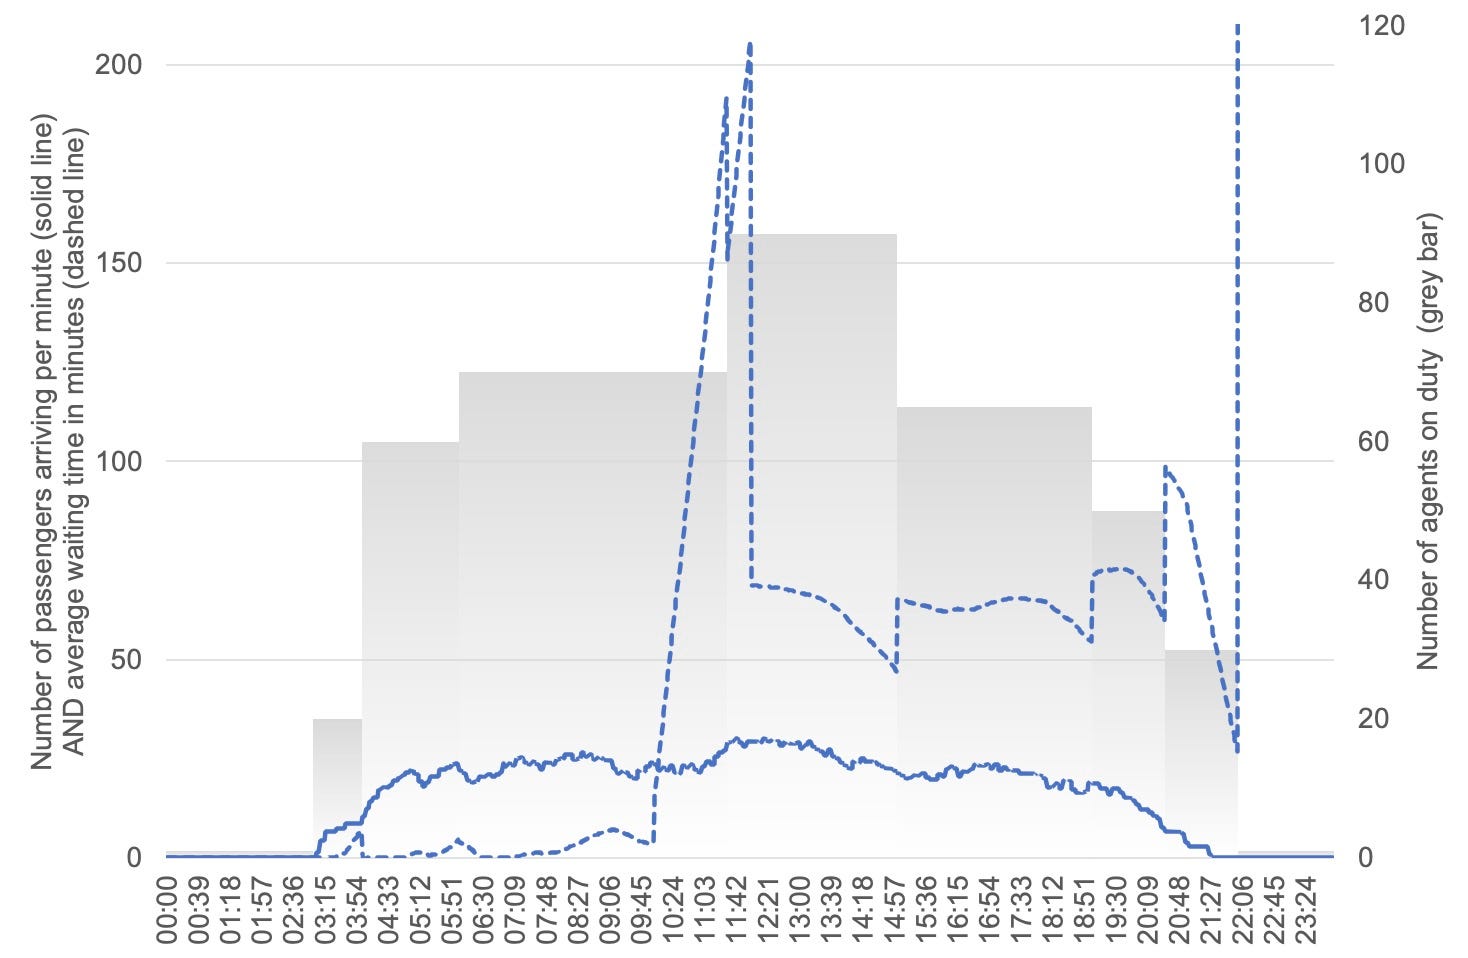
This is when operations completely collapse…
Modelling disruption across all the airlines: the results
There are many possible permutations and combinations of disruption that I could model. Type of disruption. Length that disruption lasts. Time of day that the disruption occurs. All the above relative to peak and off-peak times.
Definitely hundreds, possibly thousands. To keep things simple I note three points:
1 All the airlines have passengers checking in early in the morning. so I have modelled disruption starting at 6am
2 All the airlines have things going on early afternoon, so I have modelled disruption starting at 1pm
3 All the airlines have things going on the evening, so I have modelled disruption starting at 7pm.
I modelled disruption for the low (one extra minute to check-in) and moderate (double check-in time) cases.
In each case the disruption in my model lasts two hours, like in the example. There is no point modelling severe disruption as whenever it happens all airlines will be severely affected and have to cancel a significant part of their flying programme.I modelled disruption for the low (one extra minute to check-in) and moderate (double check-in time) cases.
In each case the disruption in my model lasts two hours, like in the example. There is no point modelling severe disruption as whenever it happens all airlines will be severely affected and have to cancel a significant part of their flying programme.
Here are the results for the low (one extra minute to check-in) scenario:
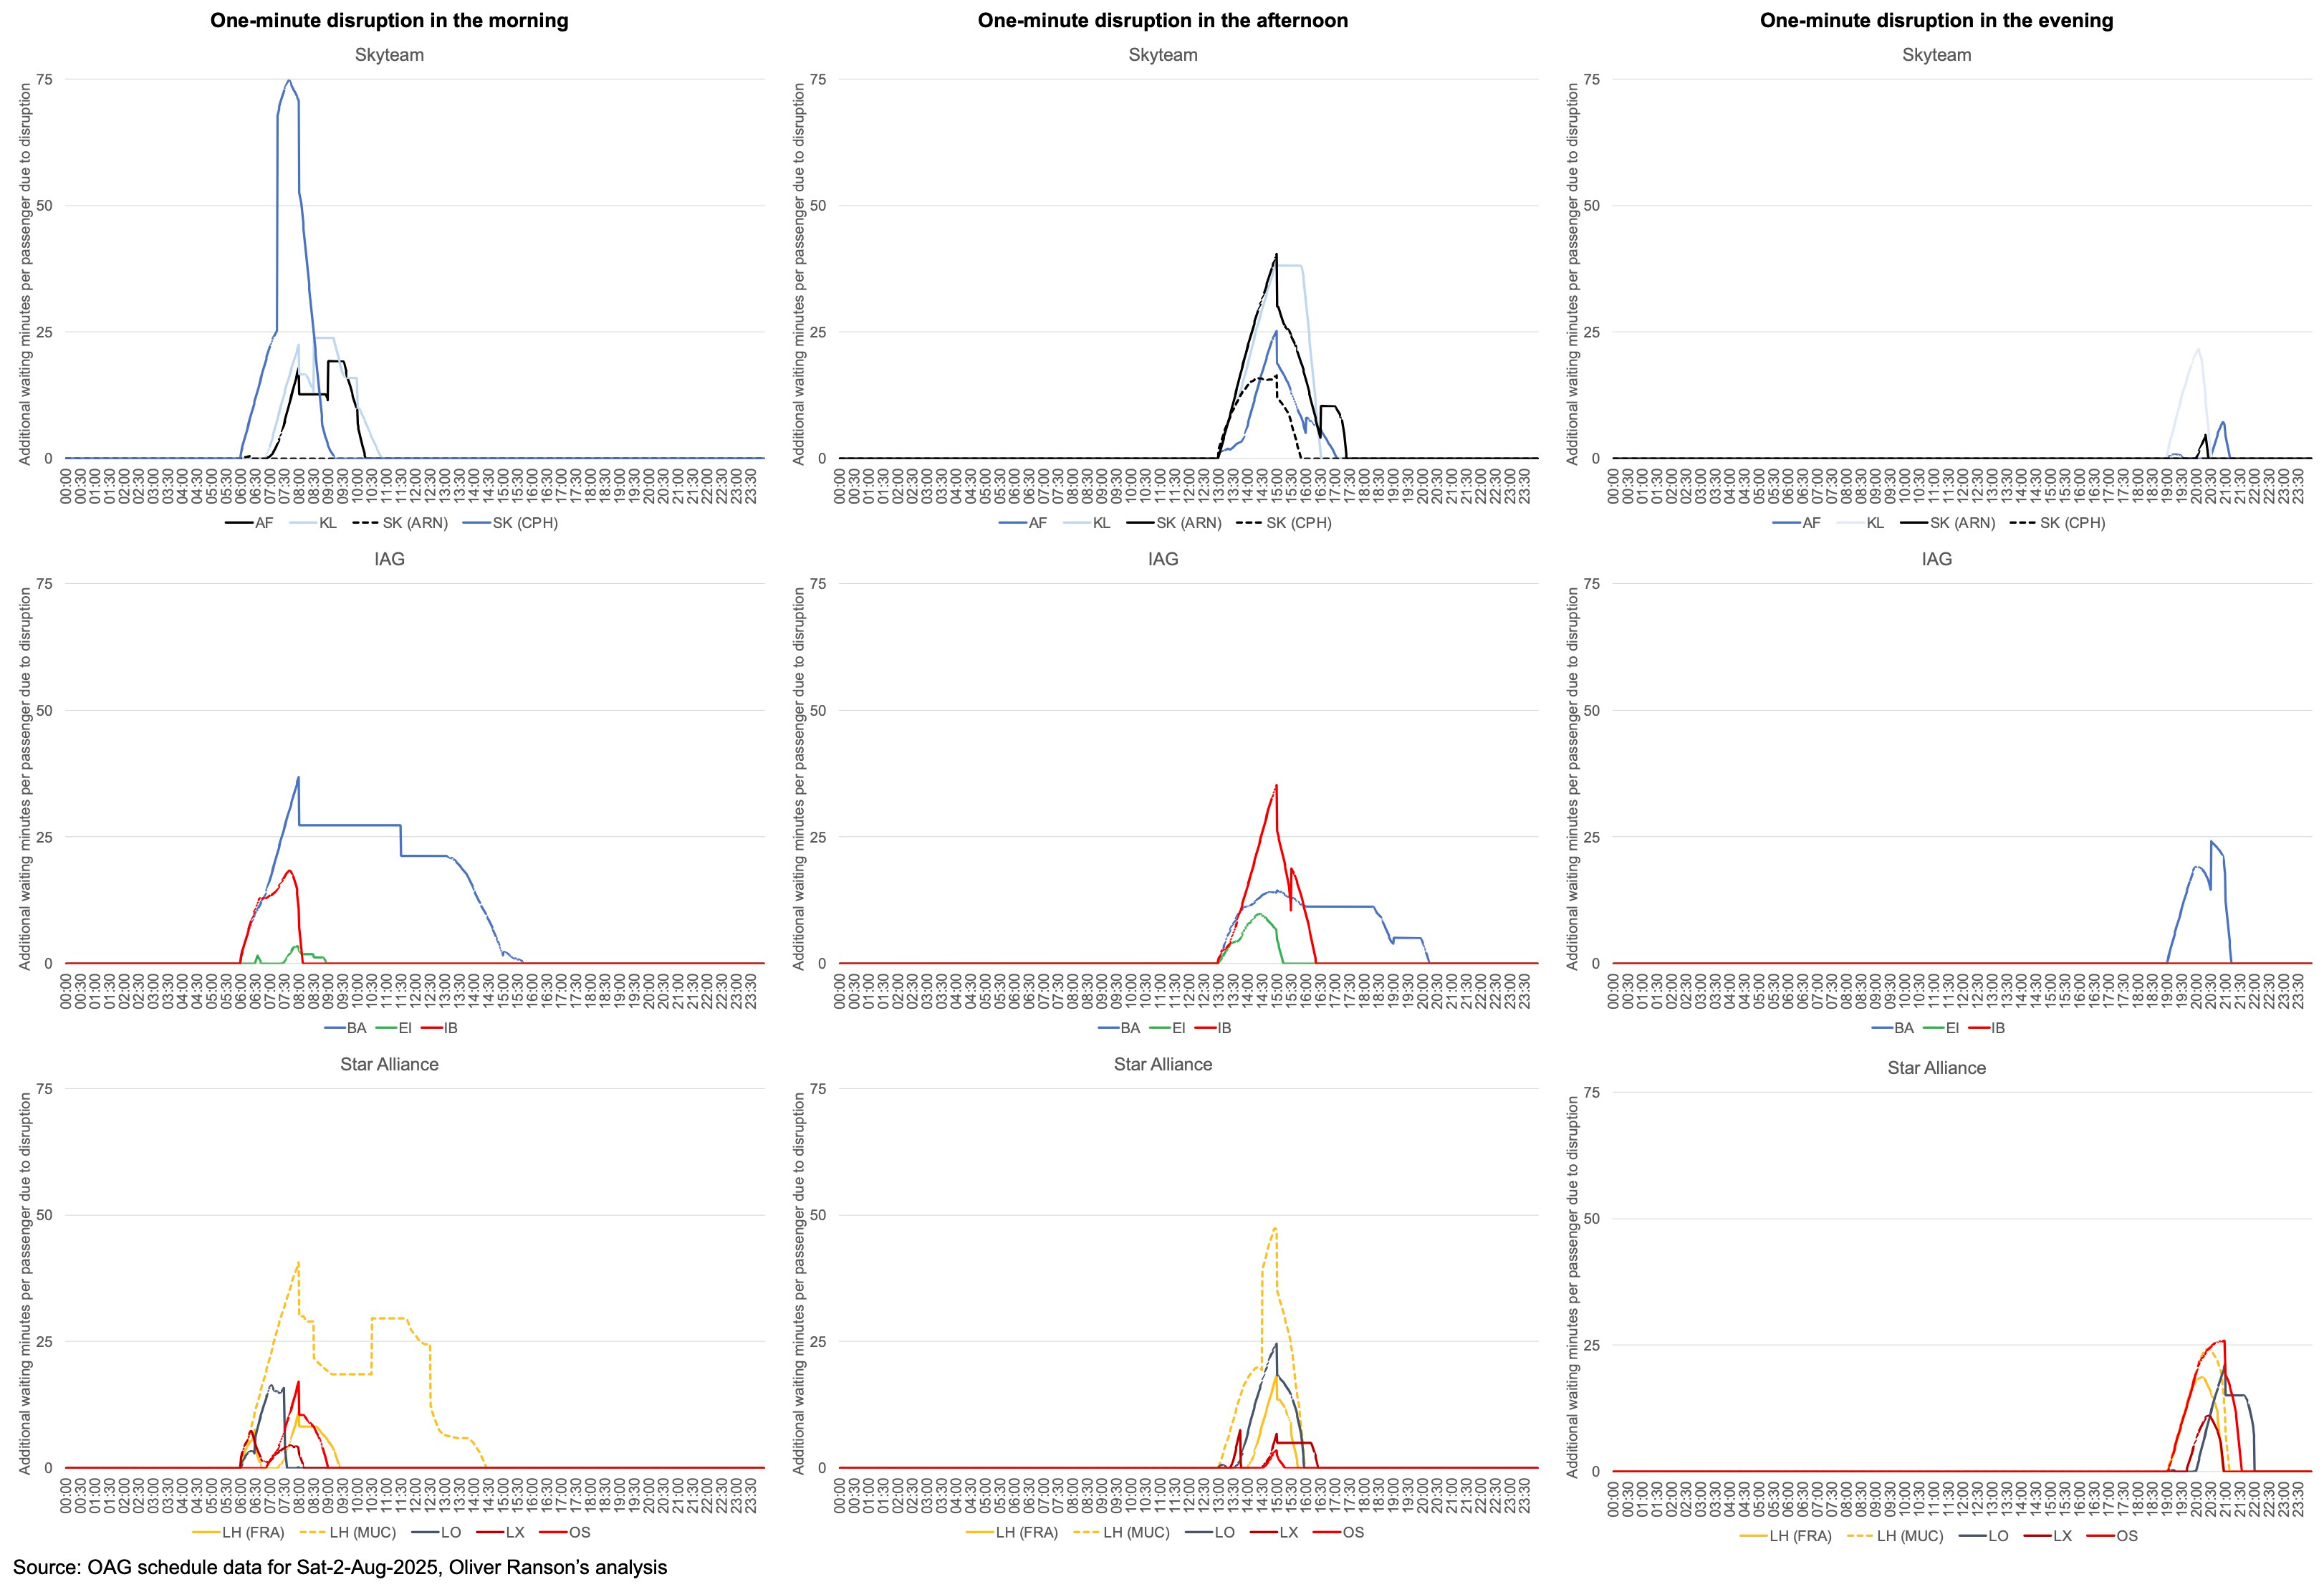
The charts show that most airlines recover from a one-minute disruption within a few hours.
For British Airways however disruptions in the morning have a knock-on effect to the mid-afternoon. Disruptions at lunch time continue impacting the passenger experience until the evening. The same is true for Lufthansa’s operations at Munich in the morning.
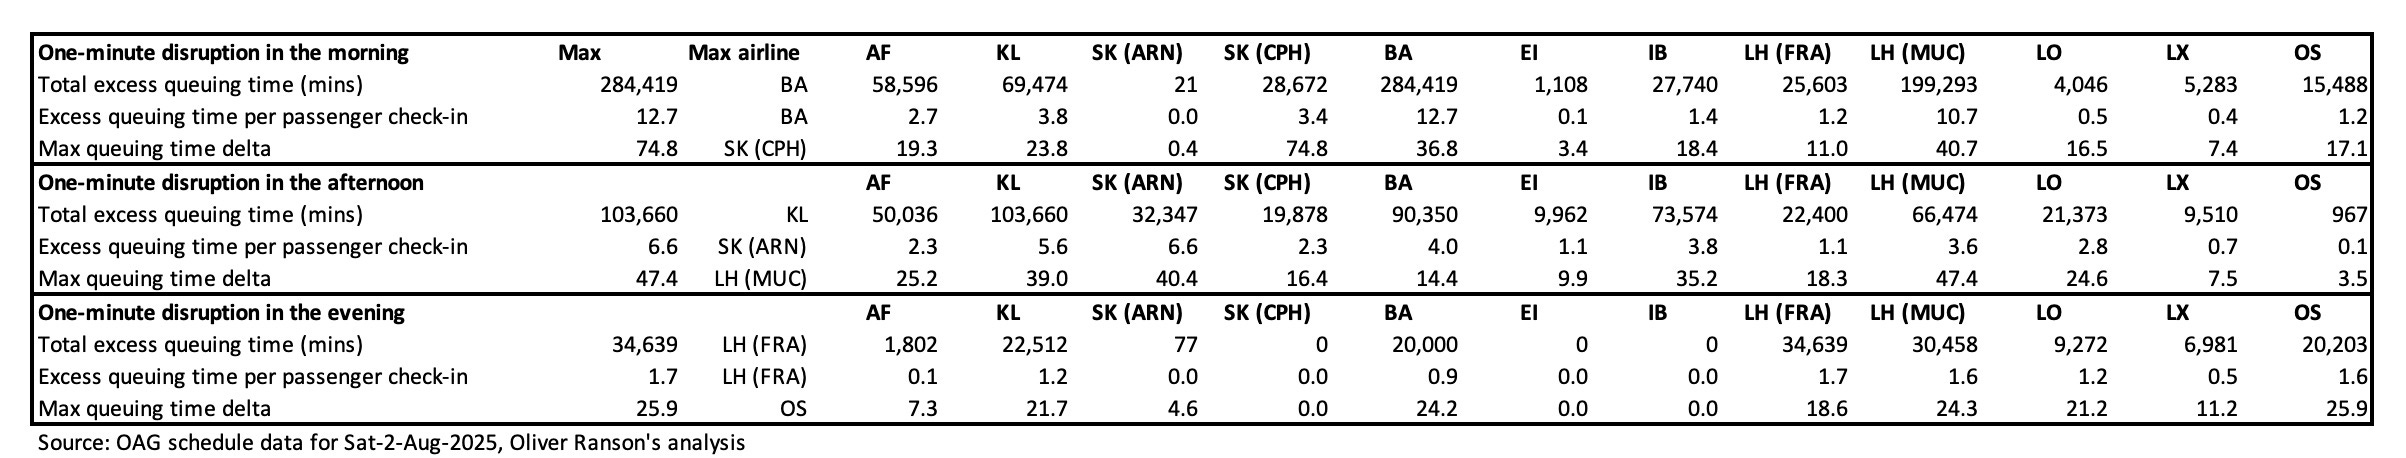
The table shows three KPIs. First is total excess queuing time, the total disruption caused across all passengers. The number of minutes suffered in extra queuing by all passengers in the day. Airlines whose flights are spread across the day rather than concentrated in peaks are at risk here.
The second KPI is excess queuing time per passenger check-in, the average disruption per passenger. Finally there is max queuing time delta, the additional waiting time for the unluckiest passenger.
Airlines who are vulnerable to disruption across all three measures will be the most vulnerable overall.
The table shows that SAS’s morning passengers at Copenhagen would suffer the longest extra queuing time at up to 74.8 minutes.
BA however would generates the most “wasted passenger time” if their systems were disrupted. Collectively, unlucky passengers would lose a whopping 284 thousand minutes (4,740 hours, 197.5 days, six and a half months) of their lives.
Unsurprisingly, the later a disruption occurs the lower the impact. Across the ten airlines studied the maximum excess queuing time per passenger for a morning disruption would be 12.7 minutes. That falls to 6.6 minutes and 1.7 minutes for afternoon and evening disruptions respectively.
Here are the results for the moderate (three extra minutes to check-in) scenario (note that the scale on the left-hand axis has increased to 250 minutes from the previous set of charts, which maxed out at 75 minutes):
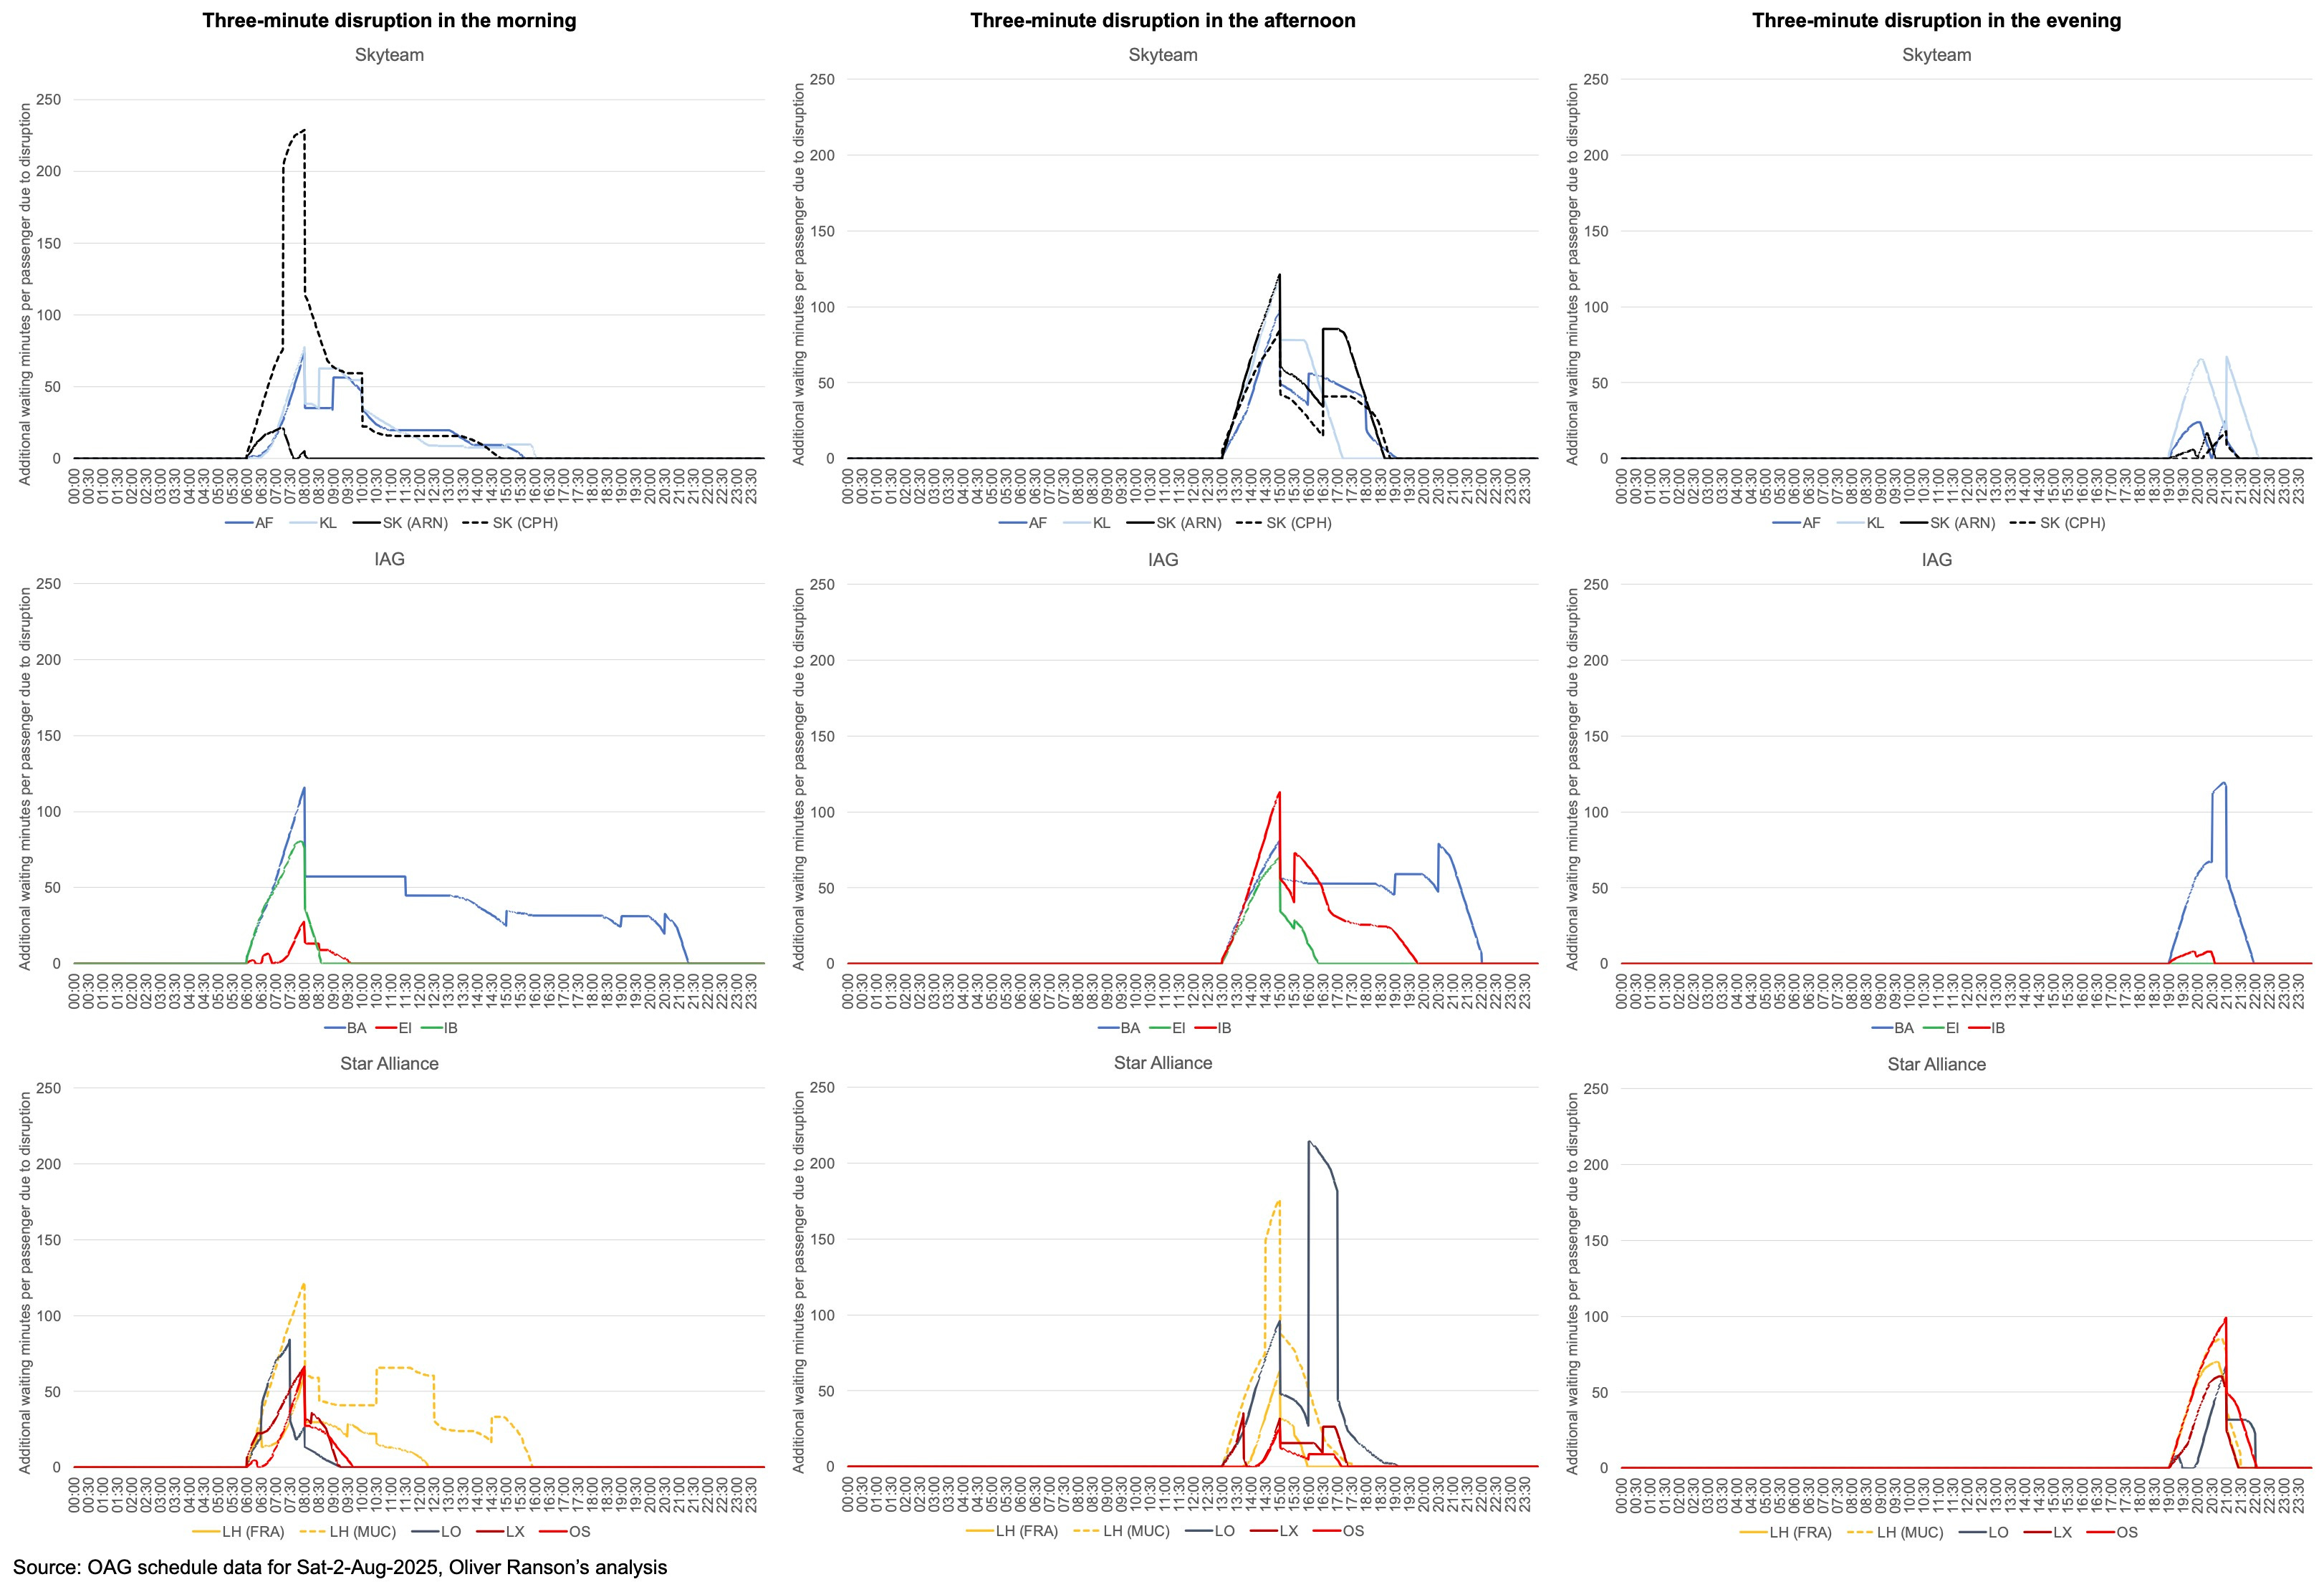
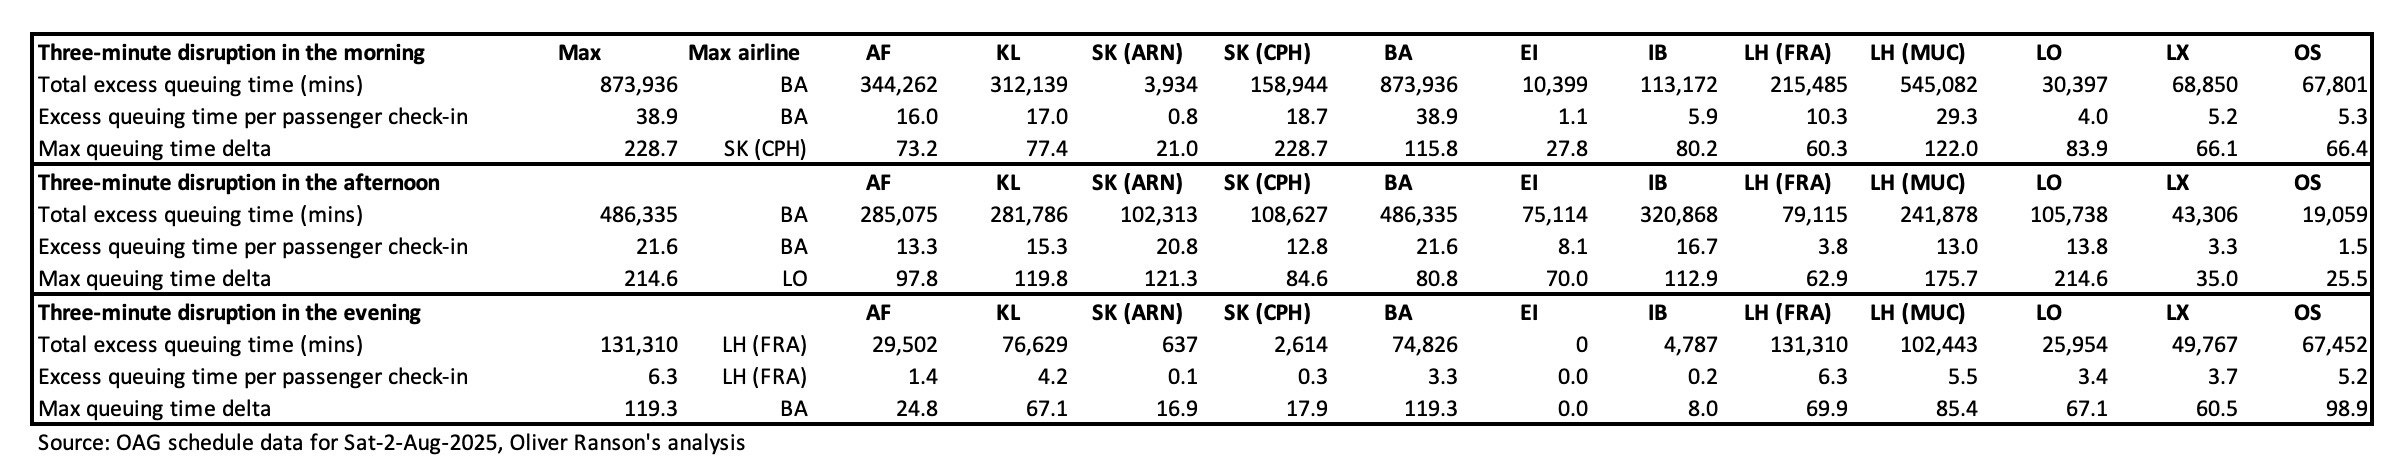
The tables show that British Airways seem to come out the worse, with the greatest disruption in five out of the nine categories listed. This is because their network design leads to knock-on effects lasting add day, if a disruption occurs.
Excess queuing times of up to 228.7 minutes would be generated. Waiting times of between an hour or two would be common. All airlines would have to cancel part of their flying programme.
So which airlines are the most vulnerable?
I took each line of the two tables above. For each airline in each category I calculated a “disruption score” to dividing their KPI by the maximum of each line.
So for example, with a three-minute disruption in the afternoon, Air France passengers would suffer 13.3 extra minutes queuing on average. BA is the maximum at 21.6, so Air France’s “disruption score” is 13.3 / 21.6 = 61.6%.
I added up all the “disruption scores” to get a “disruption index” out of 18. The table below shows that BA has the highest score. They are closely followed by Lufthansa at Munich, who come second in many categories.

Conclusion
British Airways is the European airline that is most at risk from disruption this summer. Their IAG partner Aer Lingus is the least vulnerable.
If BA’s systems suffered even a “small” level of disruption, unlucky passengers would collectively lose a whopping 284 thousand minutes (4,740 hours, 197.5 days, six and a half months) of their lives.
Airlines and airports are highly optimised environments. So when systems work as intended, things go smoothly.
When systems go down or operations snap, passenger experience degrades quickly. Queues form, flights are delayed and operator reputations suffer. Four major systems that can go wrong include:
1. Departure Control (DCS)
2. Baggage Reconciliation (BRS)
3. Load Control
4. Ramp Management
I collected data for the peak-of-the-peak schedules at ten major European airlines in twelve hubs on the first Saturday in August 2025. I calculated how many passengers airlines can expect to arrive at counters on a minute-by-minute basis, assuming 33% connections, 85% seat factor and 75% needing to check a bag or do a visa check.
Most of the carriers are quite ‘peaky’. Iberia, Swiss and Austrian have five peaks each. Lufthansa has four at both of it’s hubs, as do Air France. SAS and KLM’s passengers are spread across morning, mid-day and evening peaks.
Aer Lingus has a morning peak and then a spread of arrivals through the day. British Airways is more of a ‘hump’, which is why they performed worst. Because their passengers are spread evenly through the day, there is no time for queues to dissipate, and disruptions have long-lasting effects.
I modelled “small” (a one-minute increase to the time required to check-in each passenger) and “medium” (doubling the check-in time) disruptions. Larger disruptions were not modelled as they simply result in the collapse of operations for everybody.
Have you ever wondered why airports always seem to have more queuing space than they need? This is why. When “small’ disruptions occur, queues get long quickly and those tensa-mazes fill up. Airlines cancel shorter flights. “Medium” disruptions cause queues out of the building and a significant part of the flying programme needs to be cancelled.
I used three measures of disruption to calculate a “disruption index”:
1. Total excess queuing time across all passengers, representing the total impact of disruption
2. Excess queuing time per passenger, representing the impact of disruption on the average passenger
3. Maximum excess queuing time, representing the impact on the unluckiest passenger.
The ranking is:
Most at risk: British Airways (Heathrow Terminal 5)
Followed by:
Lufthansa (Munich)
KLM
Lufthansa (Frankfurt)
LOT
Austrian
Air France
SAS (Copenhagen)
Iberia
SAS (Stockholm)
Swiss
Least at risk: Aer Lingus (Dublin)
BA is most at risk because they have built a schedule that prioritises “broad and deep” connections. This is their “hump”. They have as many destinations as possible connecting to everywhere else. There are no banks of flights or passengers so it takes a long time for things to recover when they do go wrong.
At other airlines, to some extent connectivity is “shallower”, as flights connect to others in the same bank. When a disruption happens, it impacts the bank in progress at the time, but once it is over things have a chance to get back to normal before check-in for the next bank of departures starts.
This is an important finding. Put simply: airlines have to trade off the benefits of broader and deeper connectivity when things are going well against the risks and costs of disruption when they are not.
Read more on Airline Revenue Economics
Great airline lounges are revenue generating spaces, not cost centres